
Welcome to a series of posts sharing how we #Desmosify the curriculum from Open Up Resources/Illustrative Mathematics. You can use this lesson for free, or sign up to get many more activities just like it in our core middle school curriculum!
Here’s how we #Desmosified an Open Up Resources/IM lesson to help students find associations in data..
Desmosification #1: Estimate, then calculate.
Two-way tables are a powerful way to represent data from the world. Associations that were invisible in a one-way table suddenly pop to the surface under the bright light of the two-way table, like the association between gender, age, and survival on the Titanic.
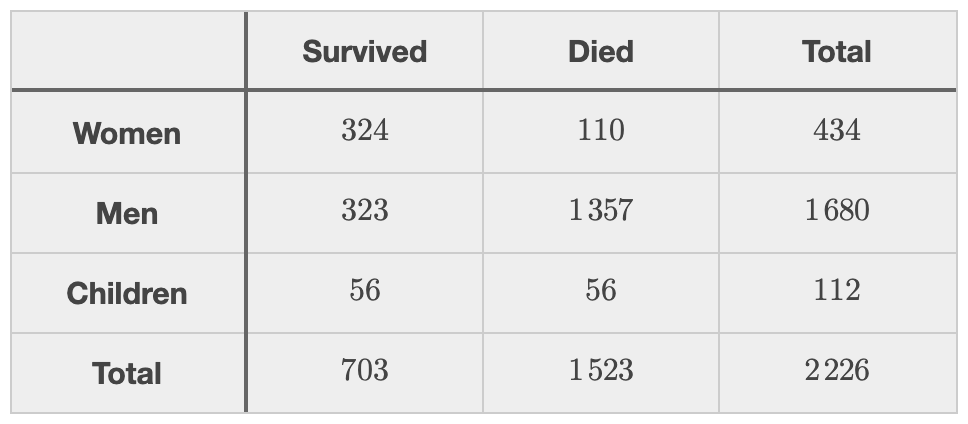
At Desmos, we try as often as possible to start with a student’s concrete and contextual knowledge before inviting them to develop more abstract and mathematical knowledge. Once a curriculum digests a context into numbers, certain contextual questions like “what do you think?” become harder to ask. So we chose to start this investigation without numbers, inviting as much contextual thinking from students as possible.
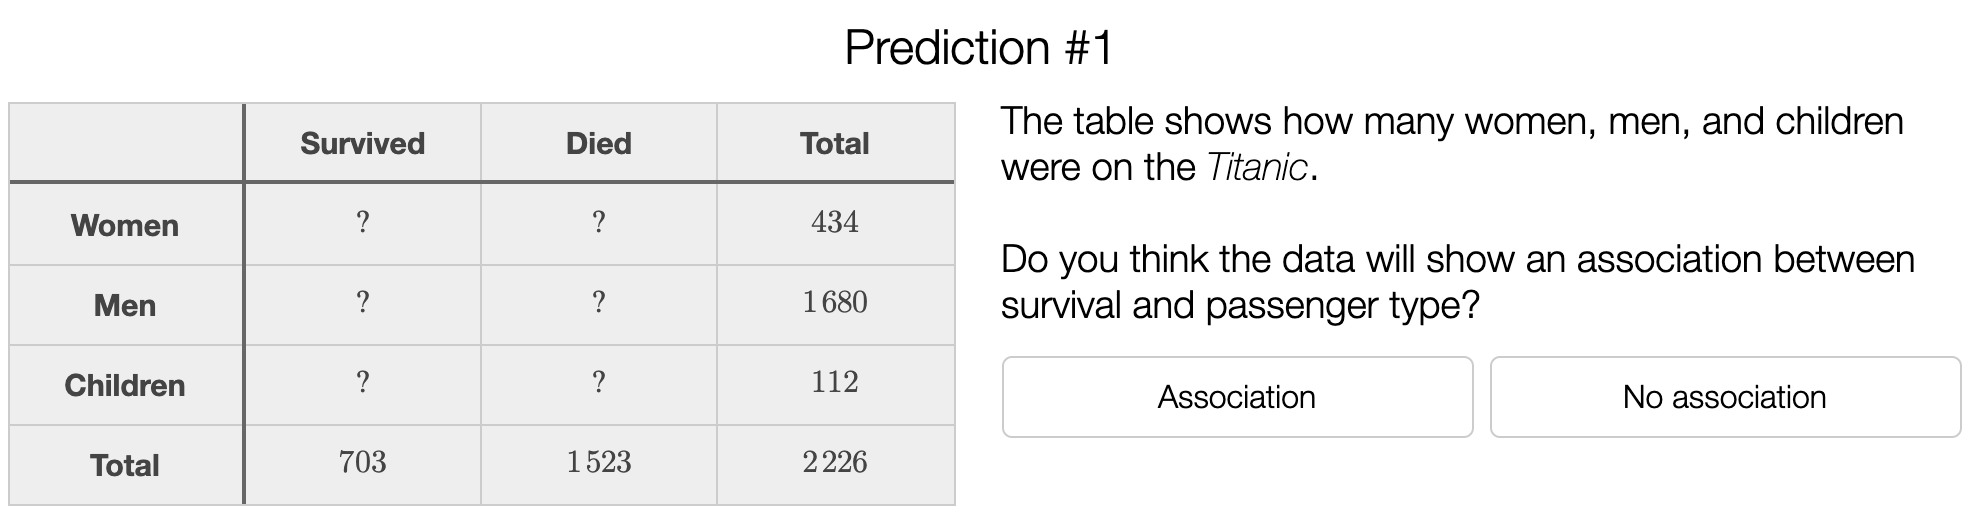
An advantage of the digital medium over print is that we can always add the numbers later.
Desmosification #2: Create connections.
We know that students learn more when they see connections between mathematical ideas. We love that our Activity Builder allows us to ask students a challenging question about associations and then let students choose the representation that best helps them answer it.
The bar graph might lead one to conclude that the second-class cabins had the fewest survivors. But the segmented bar graph makes the distribution of survivors and casualties much clearer.
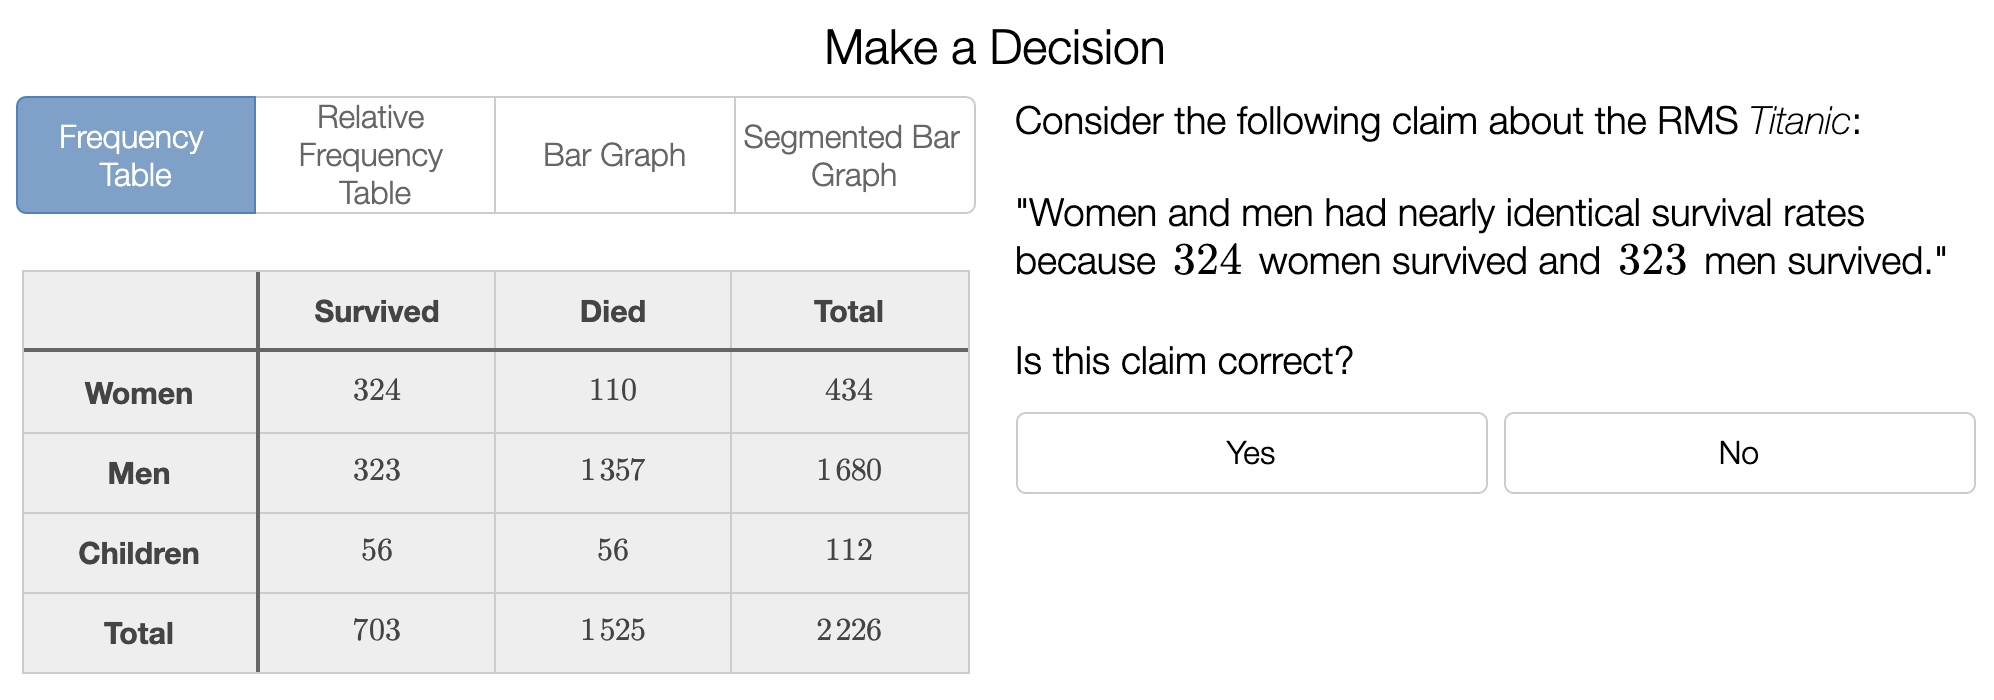
Desmosification #3: Create conflict.
Once students are fully immersed in a context, it becomes easier to ask very pointed questions that draw out subtleties in the mathematics. By asking students to evaluate a claim that seems, at least from the perspective of a bar graph, pretty plausible, we’re very pointedly inviting the student to consider the affordances and limitations of each representation. (Again, with the representation switcher!)
Behind the Scenes
Desmos lesson developer Michael Fenton describes one of the core design dilemmas of the lesson and how our team found our way through it.
This is our second version of this lesson. The first was called “Headlines.” That original lesson probably received the most mixed reviews for any of the lessons we piloted in the 2018-2019 school year. And not in the sense that it was well-received by some students and teachers, and not by others. Rather, almost everyone offered strong positive feedback for some parts of the lesson, and strong negative feedback on other parts of the lesson. So we went back to the drawing board to redesign the lesson and tried to keep the strongest bit, namely, presenting students with data in two-way tables and asking whether there appears to be an association between one variable and another.
It’s also worth noting that the original contained several unrelated data sets from several different contexts. We wanted our rewrite to contain a more coherent storyline, so we wracked our brains to find a single scenario that we could explore several different data sets within. We considered grad school admission rates and gender, income and race, athletic achievement and birth month, driving and death rates, and several other contexts before settling on the Titanic.
What Did Teachers Think
The context made all the numbers feel serious and real.
I enjoyed the real world connection of using the story of the Titanic to help teach this lesson. I teach social studies and mathematics so it was nice to see a connection that allowed students to connect math to a real event from history.
What’s Next?
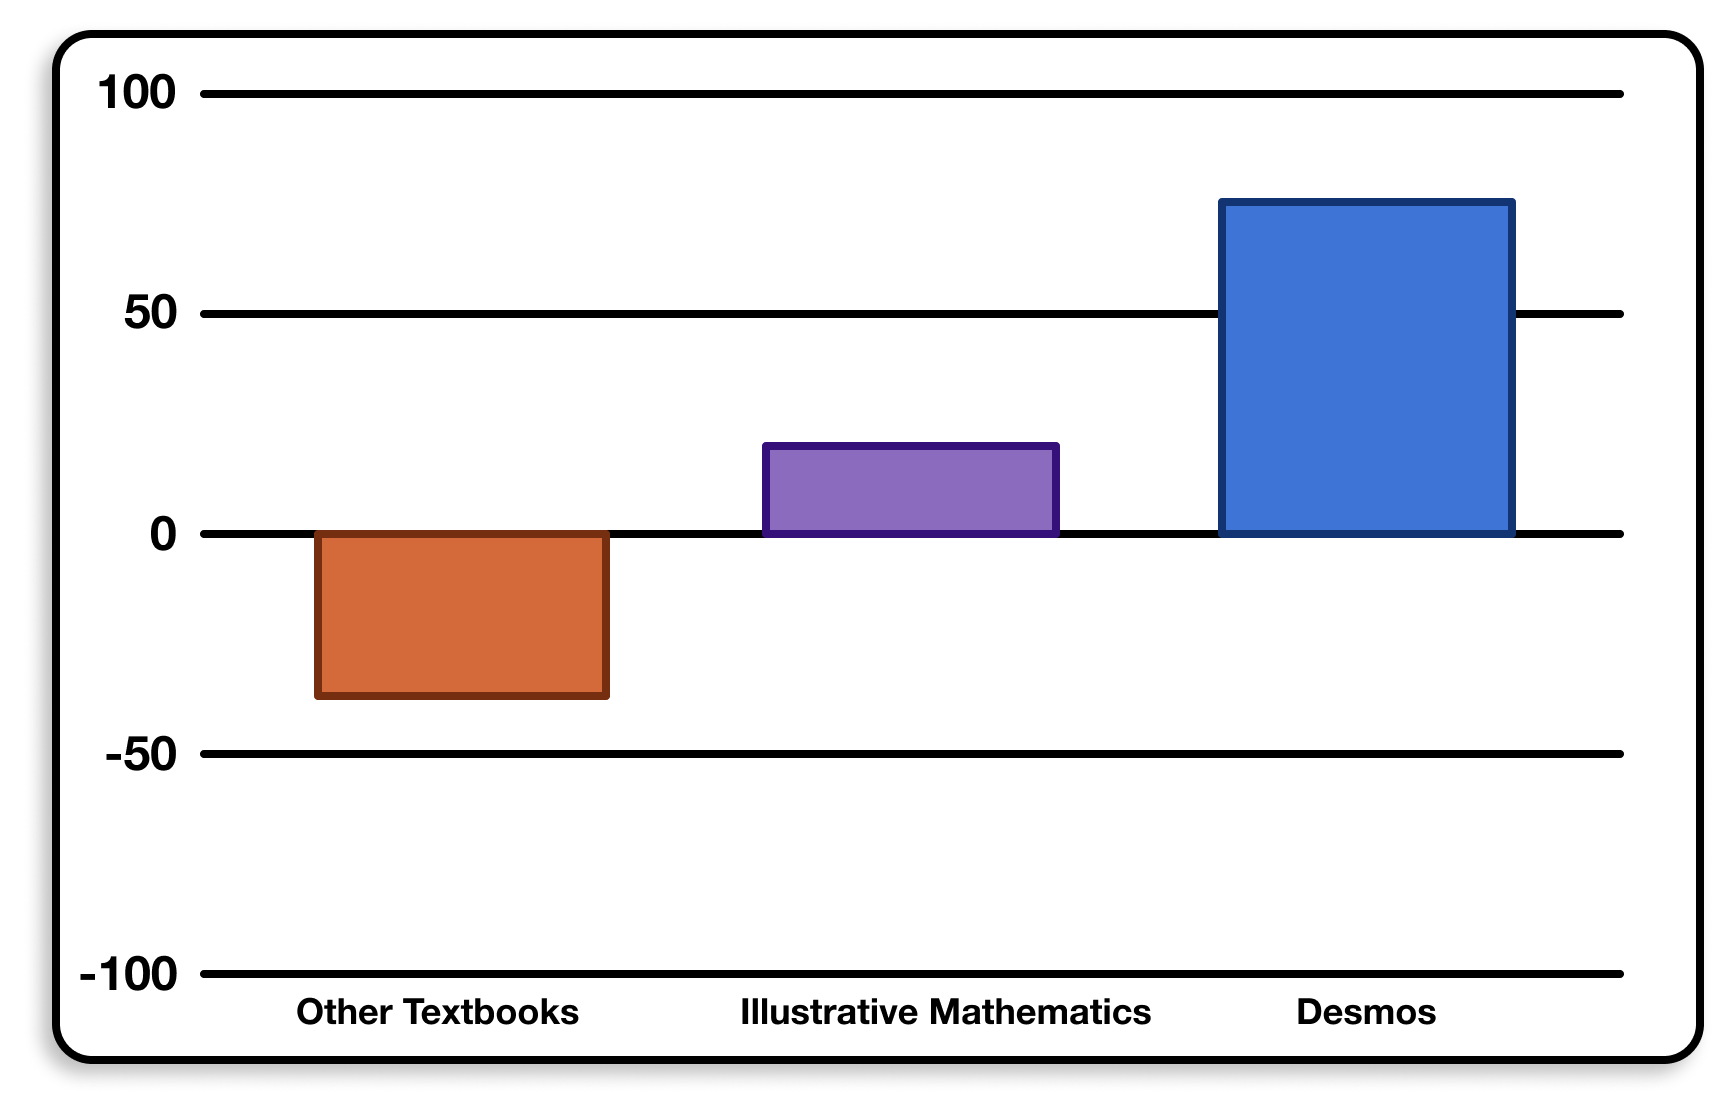
Overall, teachers in our 2019–20 pilot study really liked the Open Up Resources/Illustrative Mathematics curriculum … but they loved what we did to #Desmosify it. (Definition of the scale.)
- Invite your students to learn with one of our curriculum’s activities: Finding Associations.
- Get activities like this every day in our core middle school math curriculum.