Explore this graph

Des-blog

Recent Posts

Friday Fave for February 22

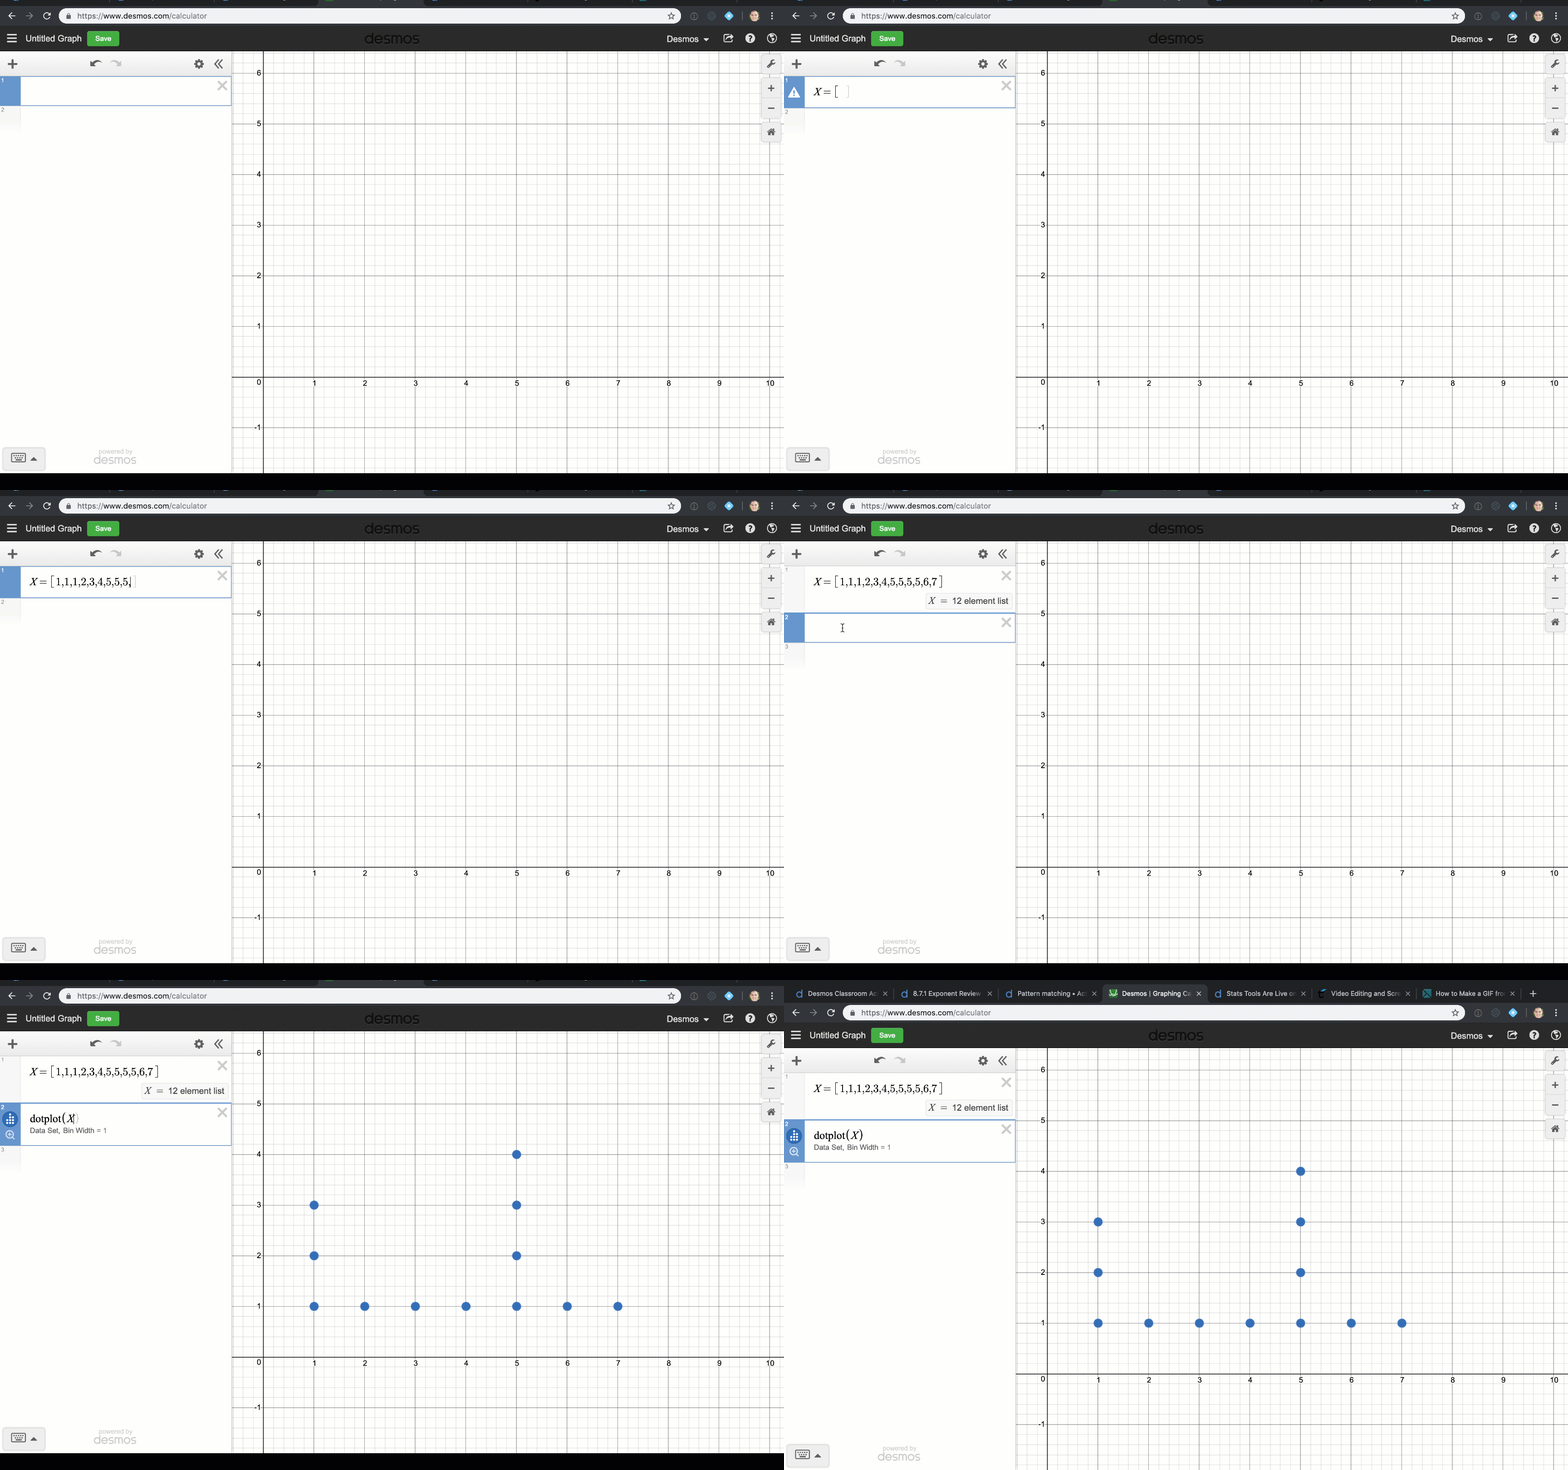
Let’s say you want to poll your students on the number of days they spend each week watching television. Now, let’s assume that you want to do something meaningful with that information. A dot plot should do the trick. Luckily, Desmos has already answered that prayer and you can go desmos.com/calculator to quickly make a beautiful, pristine dot plot in seconds. Organize your data into a list and tell the calculator you want to make a dotplot.

Animation of typing numbers into a list and then making a dot plot of that list

Now the tough part, how do you get all this class data collected into a graph that each student can work with?

Read more

Friday Fave for February 15

The Friday Fave loves words.

The best words are the ones that mean exactly what you want to say.

And Polygraph is one of the best tools the Fave knows for helping students develop things that they want to say about mathematical objects such as parabolas, functions, and hexagons.

This week, Twitter gave us glimpses into two classrooms where students were developing things to say that they’ll soon have words to express. Press “Play” to witness the sights and joyful sounds of the early stages of math vocabulary development.

Polygraph comes in many flavors, including algebra, geometry, and even numbers. In each case, Polygraph builds a context for powerful mathematical words, which is what makes it this week’s Friday Fave.

Friday Fave for February 8

The Fave is in grin-and-bear-it mode vis à vis the winter weather, and so is turning its attention to summer—July, in particular. Which is when Cohort 4 of the Desmos Fellowship will convene in sunny San Francisco.

Recently, we asked current Fellows this question:

Your colleague is considering applying for Cohort 4 of the Desmos Fellowship. What do you tell them to help them make the decision?

Read more