Happy Halloween From Desmos Is That The Sound Of

Happy Halloween from Desmos! Is that the sound of fingers clicking on keyboards, or bones rattling in graveyards?

Happy Halloween from Desmos! Is that the sound of fingers clicking on keyboards, or bones rattling in graveyards?
On September 1st of this year, we wrote on this blog about passing 2,000 Chrome App store installs of our graphing calculator. Now, less than two months later, we’re adding that many new installs per day.
Thanks to a beautiful redesign of the Chrome store, it seems as though more and more users are finding, installing, and loving the Desmos Calculator. We’ve been receiving tons of great feedback from our users, which is helping guide our next round of upgrades. If you’re one of the new visitors to the Desmos website, send us a message at calculator@desmos.com and let us know what you already love and what you’d love to see.
Happy Halloween and happy calculating!

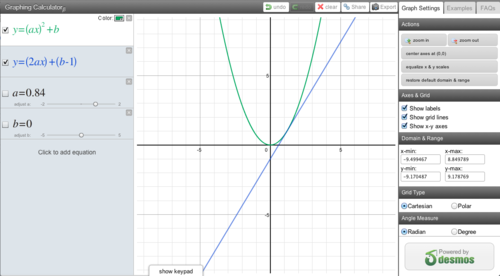
This graph of the week features some creative linking of equations and variables. Except when a=0, the blue line will always lie tangent to the green parabola, no matter how a and b change. Find the original here.