Explore this graph

Des-blog

Recent Posts

Desmos Collaborates with the New York Times Learning Network and the American Statistical Association to Improve Statistical Literacy in K-12 Education

Desmos is excited to announce a collaboration with the New York Times Learning Network and the American Statistical Association to help students experience the power of statistical literacy in the world around them in a feature called What’s Going on in This Graph?

This feature began in Fall 2017, with the New York Times Learning Network selecting a particularly relevant or newsworthy graph from the New York Times’ original reporting and the American Statistical Association hosting a live, worldwide discussion about the graph on the NYTLN website. Desmos will now use its Activity Builder technology to help its worldwide network of teachers host those discussions inside their own classrooms, asking students to interpret the graphs in rich, interesting ways.

“These graphs from the New York Times are full of facts and relationships that students can notice and wonder about,” said Dan Meyer, Chief Academic Officer at Desmos. “We hope that this collaboration will help all the students and teachers who use Desmos to read news articles with sharper eyes.”

“The American Statistical Association is proud to be in partnership with the New York Times Learning Network to host WGOITG and now to collaborate with Desmos to expand the reach and classroom discussion,” said American Statistical Association member Sharon Hessney. “With our weekly online moderation and support materials, the outstanding Times graphs, and the interactive Desmos platform, students can engage with timely graphs and statistics. There are graphs with a discussion for students of any grade and any course.”

“We think the award-winning graphs from The New York Times and the Upshot section are a gold mine for teachers,” said Michael Gonchar, an editor with the New York Times Learning Network. “Through our partnership with the American Statistical Association and new collaboration with Desmos, we hope to make more math and statistics teachers aware of how these graphs, on topics ranging from climate change and student debt to Facebook friendships and running speed, can be used in class to connect today’s world to what students are studying in class.”

Friday Fave for January 11

The Friday Fave is working to stave off the mid-winter blues by thinking about delight.

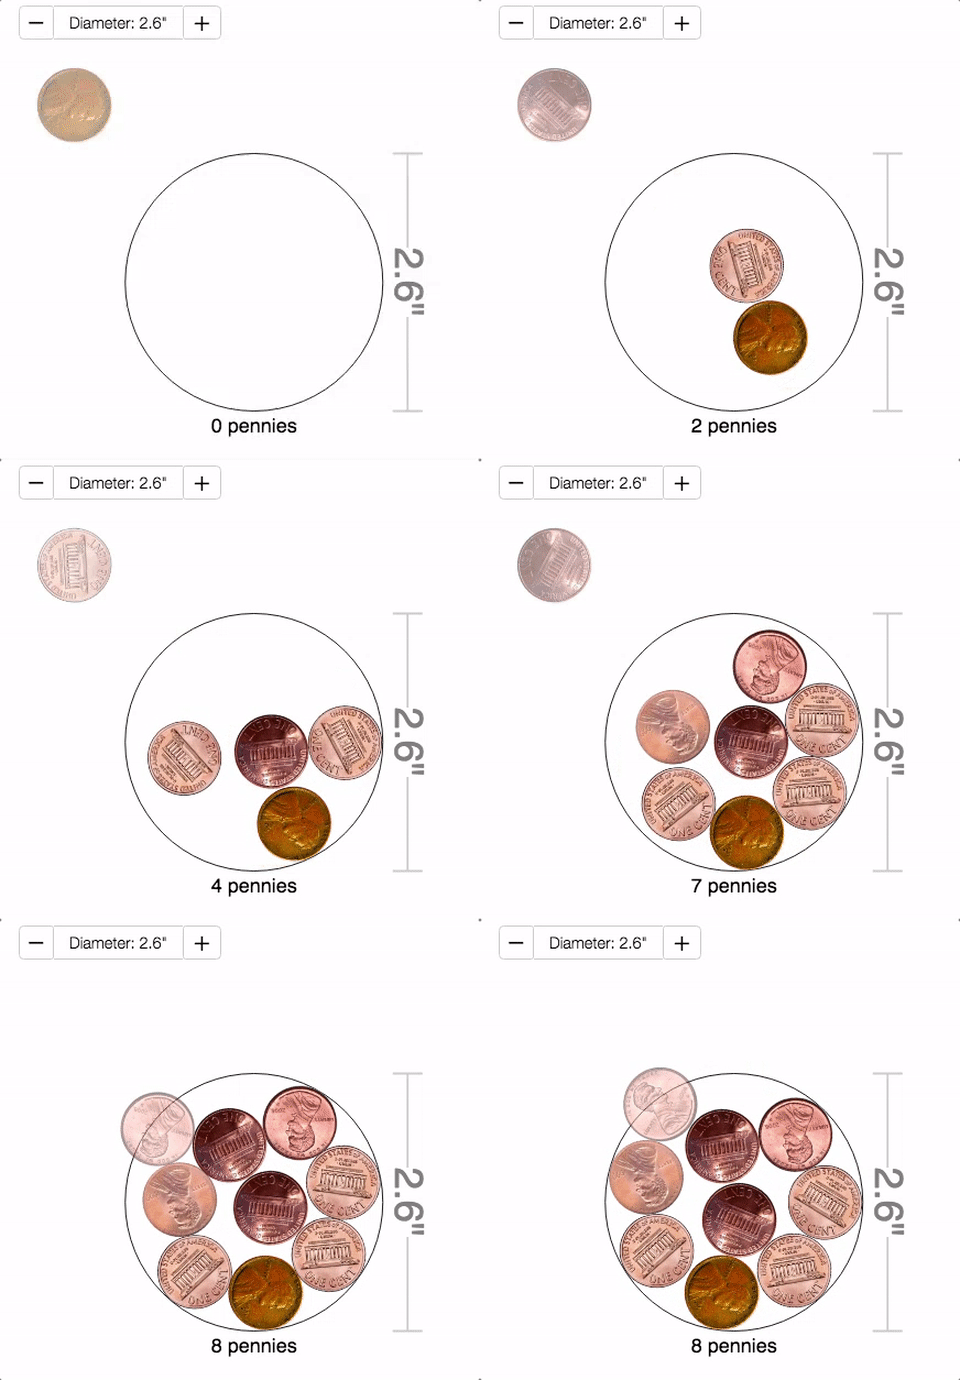
At Desmos, one of our core values is Design for delight. So when we built Penny Circle, we made the pennies bounce off each other, and we made them non-identical.

An animation shows pennies being dragged into a circle. They bump into each other as though they were real pennies.

We made a robot celebrate your mathematical victories in Adding Whole Numbers

An animation shows playing cards being dragged onto two different mats on a table, with the goal of getting the sum of the cards to be the same on both mats. 7 and 6 go on one mat; 8, 2, and 3 go on the other. The robot scans the cards and throws up its arms to celebrate the student's success.

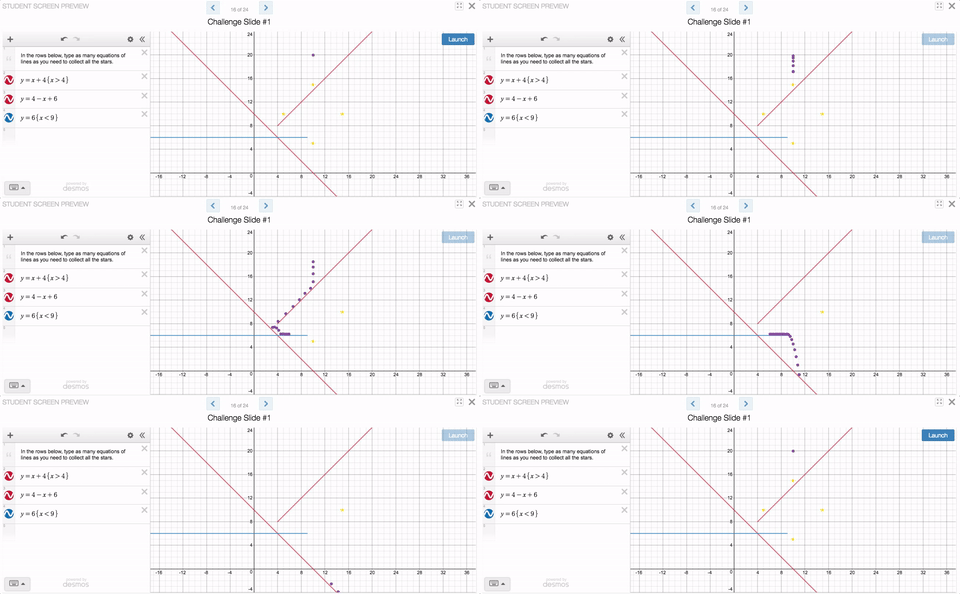
And we made Marbleslides, where you can launch your marbles into the air and through the stars.

An animation shows marbles being launched on a graph; they drop, roll along several graphed lines, through stars that serve as targets, and then down off the bottom of the screen

Of course, we don’t delude ourselves that the electronic world is the primary source of delight in classrooms. We understand and celebrate that there is delight in a clever new student solution, in persistence paying off, and in just connecting to each other as human beings in a shared community. But isn’t it lovely when electronic math lessons bring a spark of delight too?

Delight. This week’s Friday Fave. Find it in lots of places at teacher.desmos.com, including these activities:

Adding Whole Numbers

Marbleslides: Lines

Coin Capture

Transformation Golf: Rigid Motion

Friday Fave for December 21

This week—in this holiday season—the Fave turns its attention to the amazing community of teachers using Desmos tools to support students in creative ways. Click through on each of these posts for great ideas, resources, and links.

In this lesson plan in the form of a blog post, Jenn Vadnais uses Desmos as an instructional tool to help students understand percents and proportions.

The other day a teacher asked me to create a lesson that had elements of a Number Talk involving percents. Her students had recently been discussing proportional reasoning and the constant of proportionality. Knowing this, I decided to combine percents and proportional reasoning with Desmos. Here’s the resulting lesson.

On his blog, Paul Jorgens combines several Desmos tools to support classroom conversations that help students develop mathematical vocabulary with increasing depth and sophistication.

If we are going to develop vocabulary through experiences, we need to build in those activities into our lessons. We try to utilize our “fire up” time to open the class.

Julie Reulbach writes about how she has her students create Desmos art. She supports their learning and project organization by having them complete their art inside a Desmos activity.

Having them do the project through an Activity Builder helped me manage all of their graphs so I could easily view them and access them for help. By using an Activity Builder, I was also able to include the instructions for the projects and helpful tips for them…I had them print out their Desmos Art, and I made a huge collage of it on my wall in the back of the room.

Supporting students with tools, language, and art—this week’s Friday Fave.

Note: The Fave is taking a couple weeks off, and will see you again in the new year. All the best to you, your colleagues, students, and loved ones until then.