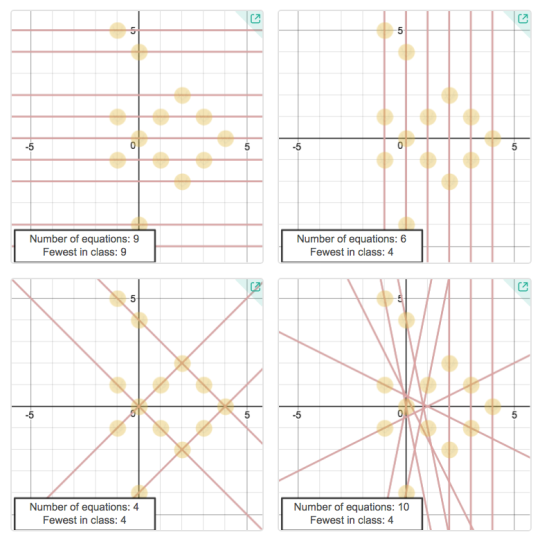
Explore this graph

Des-blog

Recent Posts

Friday Fave for November 2

The bell has rung, your classmates have settled into their seats, and the teacher stands at the front of the class next to a chalkboard and overhead projector, ready to deliver today’s lesson.

All right, everyone,” she announces while gesturing towards the blank chalkboard, “please solve these equations using your handheld calculators– the ones with the broken displays.”

This assignment may sound outlandish, but students with visual impairments face similar challenges using technology in the math classroom every day. New technologies have the potential to empower students, but without care, they may instead present insurmountable barriers to access.

Our mission at Desmos is to help every student learn math and love learning math. Not some students. Every student. With that in mind, we introduced improvements to the calculator to ensure students who are blind or visually impaired have the same opportunities as their peers to discover the joy of learning math. Thanks to technologies like screen readers (which provide spoken or Braille feedback to mainstream computers, tablets, and phones), people who are blind or low vision have the opportunity to use the exact same programs as their peers. Naturally, it made sense to extend the utility of our existing calculator offerings to include screen reader support.

More recently, we extended this functionality to our activities, modifying them to meet the highest possible standard of accessibility our tools can offer. You can find all the screen-reader friendly activities here, or by visiting teacher.desmos.com and typing “screen reader” or “accessible” into the search bar.

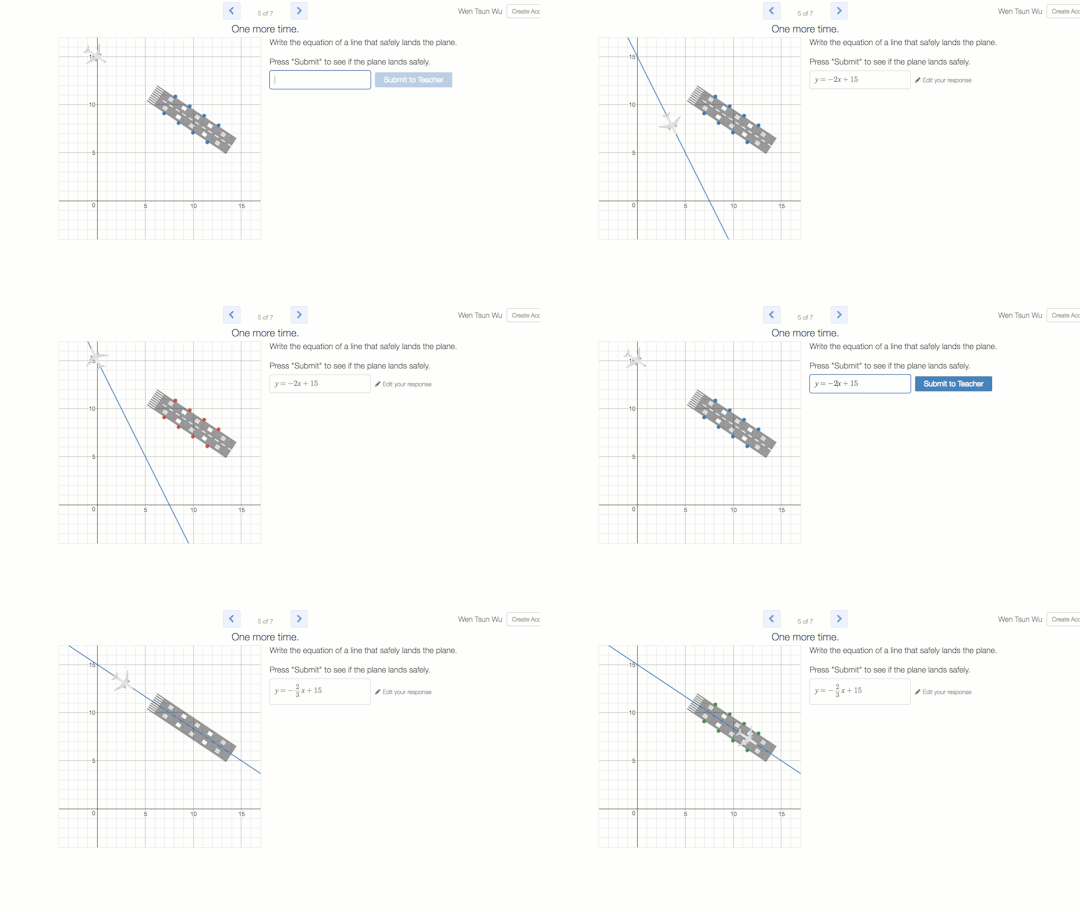
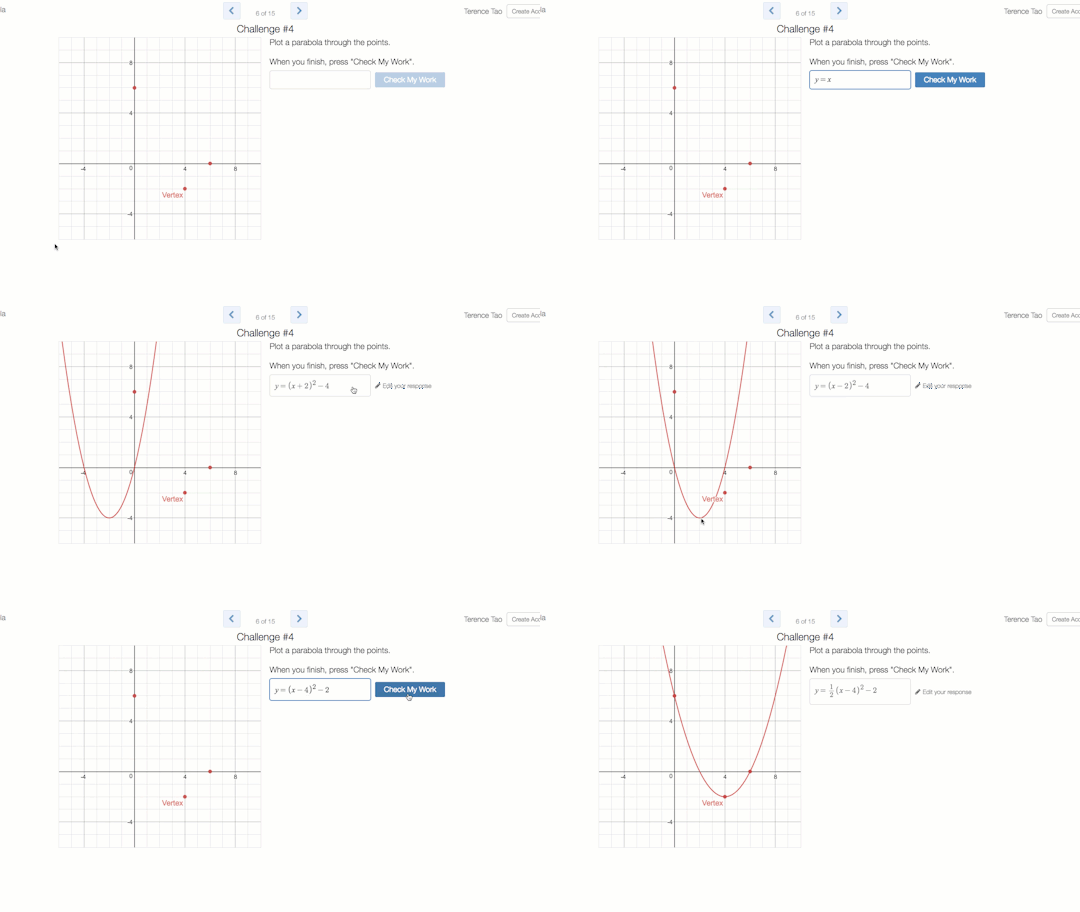
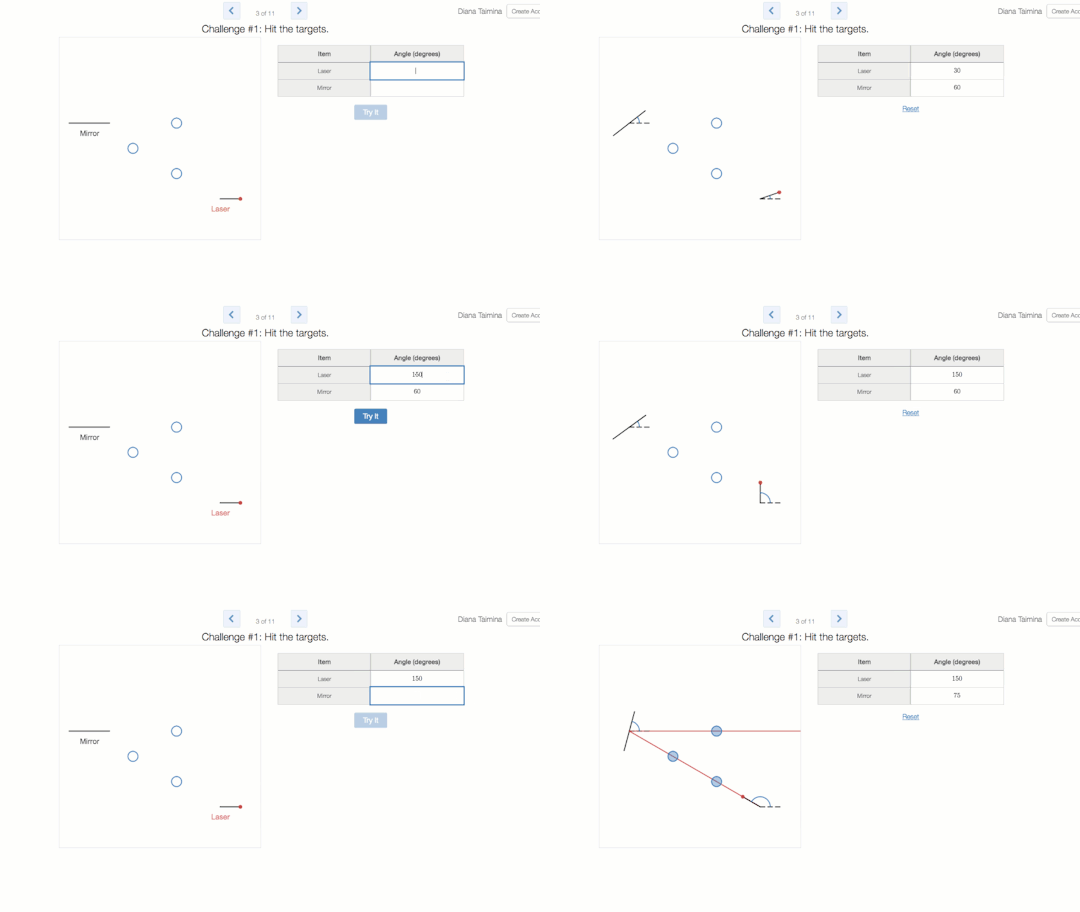
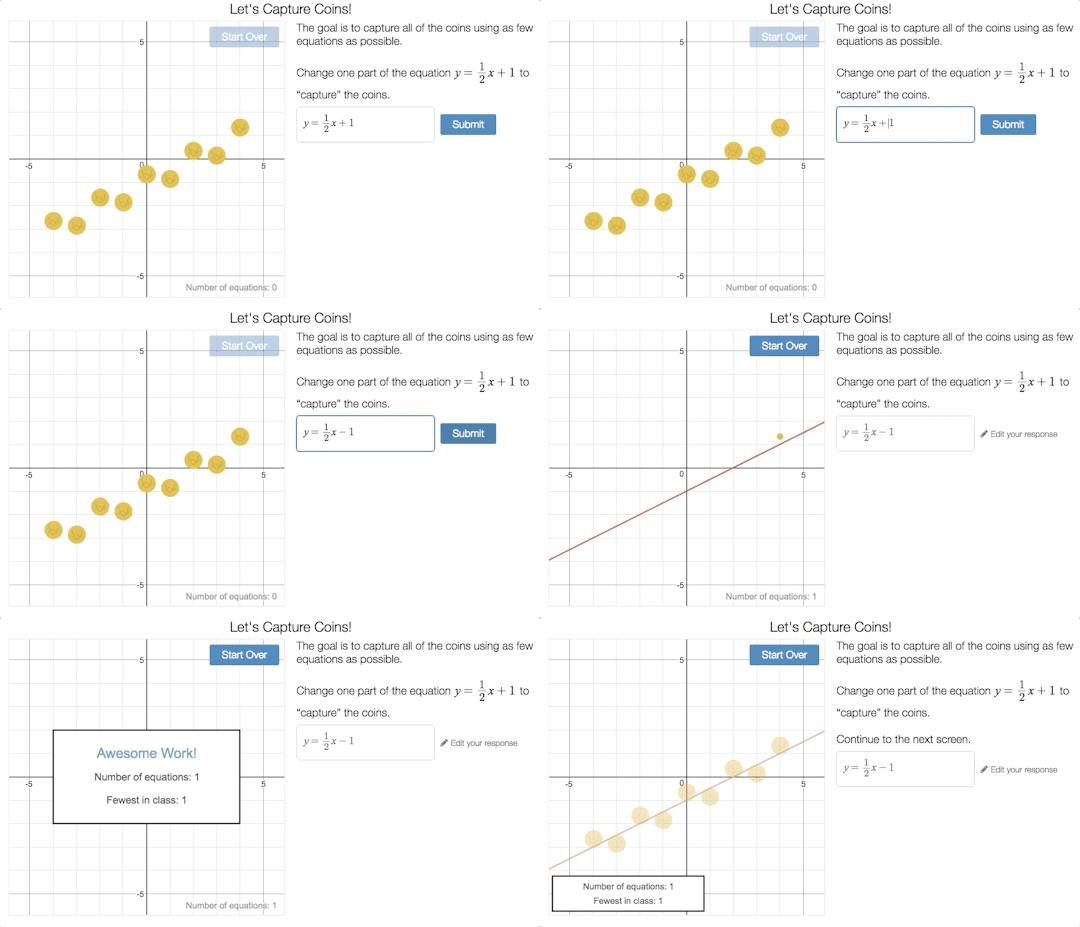
So how did we make this happen? Many of the components of a Desmos activity have built in accessibility, meaning that you can interact with them via the keyboard and a screen reader. We added to this accessibility by adding narrations to graph screens to help students learn about a graph, interact with it, and receive feedback.

image

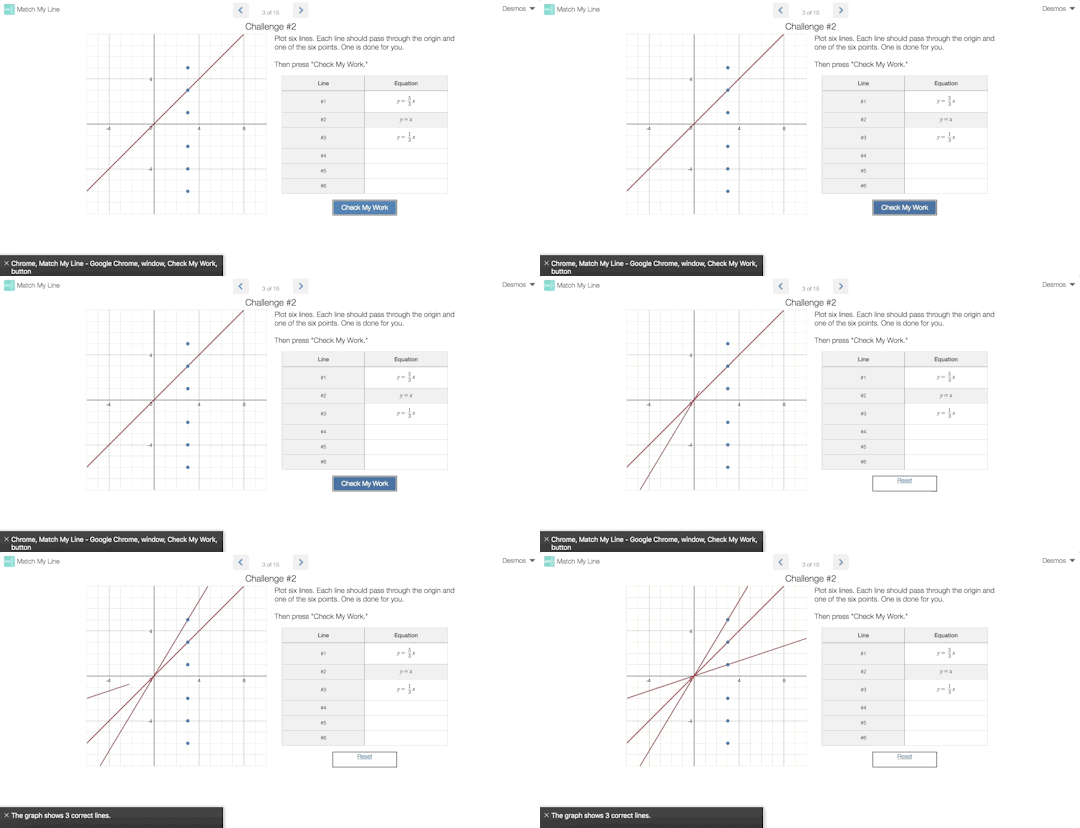
In this screen from Match My Line, when a student submits a correct equation, the screen reader tells them the number of lines that have been correctly graphed.

Students can also use the audio trace functionality from the graphing calculator to learn more about a graph within an activity.


Interested in learning more about Desmos accessibility? Get started at learn.desmos.com/accessibility, then dive deeper by watching our Introduction to the Desmos Graphing Calculator and Accessibility Tools webinar and heading to www.desmos.com/accessibility.

We’d love to hear your feedback! Let us know what you think at accessibility@desmos.com.

Friday Fave for October 26

The Friday Fave would like to tel youl about a very handy calculator feature, and then invite you to do some math.

The feature first.

Imagine you’ve got a set of points, and you’ve named them A, B, C, and D. You probably want to make a quadrilateral from those four points, and it used to be difficult but now it is easy.

What sort of thing is a quadrilateral? Why, it’s a polygon. So you just tell the Desmos calculator that you want to make a polygon with those four points, and boom!

Alternatively, you may have specified the x-coordinates of your quadrilateral with a list, and the y-coordinates with another. Do not ask the Fave how the calculator can interpret two lists just as easily as it can interpret four points, but it can.

This second version of polygon is especially handy because you can operate on a list (you cannot yet operate on points except by dragging them around). So now let’s do a little math together, shall we?

What do you suppose our polygon will look like if we type polygon(X,Y-4)? Click through on the expression to find out.

What about polygon(2X,Y)?

And finally, what will polygon(Y,X) look like?

Bonus question: What transformation do you need to apply to make our polygon no longer be a kite, and how might we express that transformation algebraically?

Now that the Fave has you thinking about polygons, here are some delightful ways to extend your thinking…

Polygraph: Advanced Quadrilaterals

Polygraph: Basic Quadrilaterals

Polygraph: Hexagons

Polygraph: Hexagons, Part 2

Friday Fave for October 19

  • The personified Friday Fave is a figment of the imagination.
  • The Friday Fave posts every Friday without fail.
  • The Friday Fave seeks to help you, Dear Reader, find new and wonderful things for your students.

Two of these statements are true, and one is a lie.

When the truths and lies are about people or fictional constructs, you can’t really know which is a lie unless you know the person or construct very very well.

But mathematical truths and lies are different. The evidence for veracity or mendacity is right there in the math. If you don’t know it, you can figure it out! This makes Two Truths and a Lie fertile ground for mathematical concept development; especially if

For months, Desmos has had some secret-not-ready-for-public-use Two Truths and a Lie activities, and now we’ve polished several of these and put them on display in the searchable activities at teacher.desmos.com

image

We have versions of this activity for each of these function types: Conics, Exponentials, Parabolas, and Linears (all true; no lies!). They are Challenge Creator based, so the differentiation is built right in—your students are telling the truths and the lies, as well as determining exactly which conic (or exponential or line) they’ll lie about.

The Friday Fave (who missed last week’s post, and so now you know the lie) encourages you to click on through and give these Two Truths and Lie activities a try.