Friday Fave for June 15

We rarely ask students to do impossible things.
Or more to the point, we rarely ask students to design impossible tasks. After all, why would you?
The Friday Fave has an answer to that question actually. When you ask a student to design a task that’s impossible to solve, you engage in the student a particular kind of critical thinking. Success requires analyzing the structure of the task in a different way from solving a possible task.
Success requires considering what the solutions to the possible tasks all have in common, and then doing the opposite of that.
All of which brings us to this week’s Friday Fave: Linear Slalom.
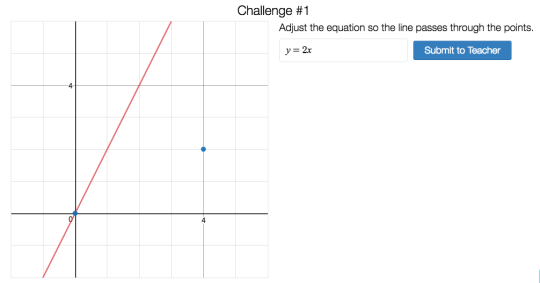
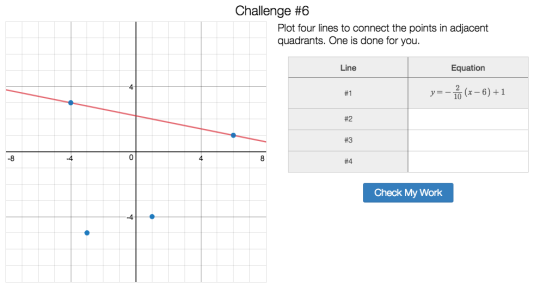
In the standard version of Linear Slalom, we ask you to send a line through sets of slalom poles.

Once you’ve got the hang of it, we ask you to design an impossible slalom.
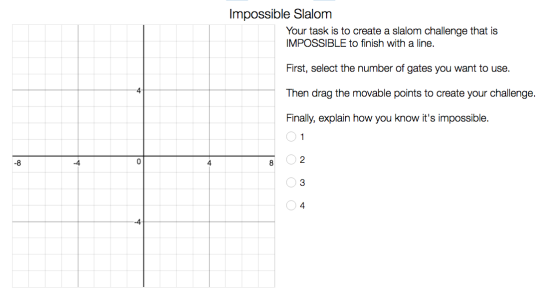
Think about this for a moment. What makes a linear slalom task impossible? Your mind may go to the vertical line test. But we actually let you write an equation for a vertical line, so you’ll need more insight than that.
Horizontal gates on the same horizontal line will work, as will vertical gates on the same vertical line. Is that all? What’s the general principle here, and why?
There’s a lot of math in just this one screen of this delightful activity, and there’s lots more math to be done as students head to the Challenge Creator to design possible slaloms for each other to solve.
But designing an impossible task is what makes Linear Slalom this week’s Friday Fave.
If parabolas are more your thing, try out Parabola Slalom.
And if you’re looking for more work with lines, here are two more lovely activities.