Friday Fave for March 9

While the Fave frequently refers to the
Desmos Activity Building Code
while going about the daily work, the Fave has been thinking a lot recently
about offering students interesting ways to be right.
Last week, the Fave featured Challenge Creator, which is chock full of interesting ways to be correct. But there are plenty of other structures in place in a wide range of activities for giving students this opportunity.
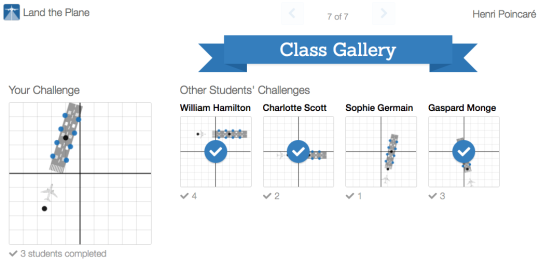
For example, we frequently ask students to decide which of two (or more) responses is correct, as in this example from Land the Plane.
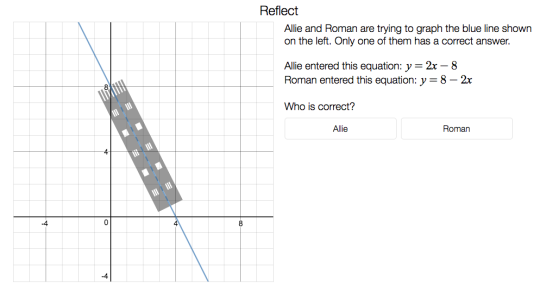
A typical class will have students using the y-intercept, students using the slope, and students using both to reason about this task. These students will use formal and informal language, which then provides a launching point for interesting conversation in a classroom even if everyone is right. Some typical responses might include:
- Roman because 8 makes more sense as the starting point
-
Roman is right, because the equation should have a negative slope and a
positive y intercept.
- Roman. You’re going down 2 , so the slope is -2
-
Roman is correct, because his coefficient is negative and so is the slope of
the line on the graph.
Four correct answers in an interesting mix of ideas and words; all at a teacher’s fingertips in the dashboard.
We frequently present examples and non-examples in order to introduce a new mathematical idea to students. In Marcellus the Giant, we show scale giants and non-scale giants and then ask students to make some conjectures about what makes a giant a scale giant.
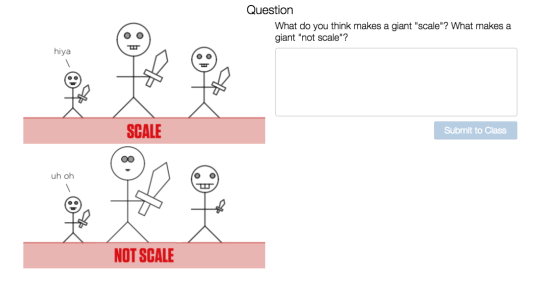
The collection of observations in a typical classroom will include angles, side lengths, some generalized ideas about doubling or tripling of lengths. There will be informal language about what the giant “looks like”. None of these will be a full and complete definition of the idea of similarity, but each of them contains a kernel of truth on which the activity and subsequent instruction can build.
A third example of offering interesting ways to be right is a favorite of the Fave: Which One Doesn’t Belong?
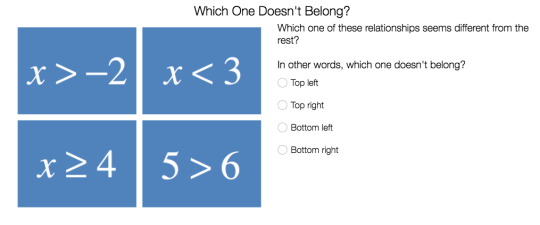
Because each of the four options has at least one reason to be the one that doesn’t belong, and also because students are creative people with clever ideas, you’ll get lots of interesting right answers to a well-designed Which One Doesn’t Belong? set such as the one in Inequalities on the Number Line.
Tapping into the minds of students is fascinating work, and it’s what makes offering students interesting ways to be right this week’s Friday Fave.