Friday Fave for August 25

The Friday Fave is spending time at the State Fair in the waning days of
summer and that has the Fave thinking about motion. And when the Fave thinks
about motion, the mind wanders to calculus.
This week’s Friday Fave is a collection of activities about motion, change, and related mathematical ideas.
In Function Carnival, students can try their hands at sketching graphs of the motion of a Ferris Wheel, the Human Cannonball, and bumper cars, then compare their ideas to the actual trajectories. This classic activity works well with students from intermediate algebra through calculus.
In Graphing Stories, video replaces animation and students are invited to consider additional variables.
Polygraph: Distance-Time Graphs offers opportunities to describe relationships based on their graphs—Function Carnival in reverse!
In Investigating Rates of Change, algebra students formalize ideas about change by playing with slopes of lines.
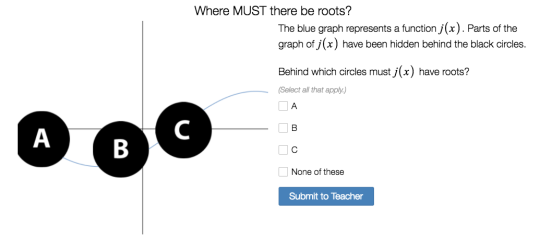
In Intermediate Value Theorem, calculus students have to be careful about their intuitions about the behavior of functions as they lay the groundwork for the formalities and pesky preconditions of the theorem itself.
Oh, and if you’re looking to bump into the Fave this week, maybe check the line for Pronto Pups at the fair. But the large-scale family math event is a better bet!