“What is the role of the teacher during a Desmos activity?”
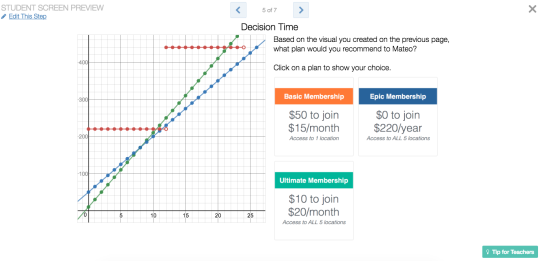
One way that teachers support student learning during a Desmos activity is by facilitating classroom conversations. This week the Desmos Fellows considered ways to plan for those conversations by looking at a teacher dashboard with sample student work. We looked at Linear Systems: Gym Membership, which asks students to analyze several gym membership plans in order to make a recommendation to a friend.

We focused on the questions below to help us discuss the role of the teacher during the activity:
-
Where would you pause for classroom conversation? How might this
conversation support the goals of the activity?
-
How would you prioritize which conversations to have with the class?
-
Which single screen has the potential for the most powerful
conversation to support activity goals and student learning?
Here’s our analysis:
Screens 1-3
These screens provide access to the context, and involve the students in developing the problem. There was also a general consensus that Screen 3 offers the greatest potential for class conversation.
-
Jade White shares with us
that “Screen 2 would be a great first place to pause; most students should
have familiarity with gym memberships but checking in on this screen to
ensure that they understand the context of the problem will help them
understand the context of the math when they get there.” Jade appreciates
that Screen 3 offers students a chance to ask their own questions, which can
help students feel more comfortable asking questions in general.
-
Serge Ballif points out that
students need to understand the considerations from Screens 1-3 if they are
to appreciate the rest of the activity. Pausing for clarification sets
students up for success in the latter half of the activity.
- Stephanie Blair and a colleague planned to extend the work on Screen 3 by having students look at all of the questions from the class, perhaps using Anonymous Mode. From there students would choose the question they thought was best, justify their choice, and explain how they would use the information they got from the question to help Mateo choose a gym membership plan.
- Anna Scholl likes this screen coming early in the activity because students can discuss and “know” their answer, and then dive into how to show their answer visually, possibly with multiple representations.
Screen 4
The prompt for Screen 4 is to “Use Desmos to create a visual tool to help Mateo decide which gym membership to choose.” Here students will represent their mathematical thinking using either a graph, table, or equations. Student work for this screen leaves room for interpretation of what students understand and are still developing ideas around, and for that reason Screen 4 is our second place winner for classroom conversation potential.
-
Jenn Vadnais would use this
screen to highlight multiple representations by connecting a table and
equation with the graph. Using points in addition to lines will help our
concrete thinkers clearly see the monthly markers.
-
Linda Saeta wants to make sure
students understand what their models tell them about the world. Questions
such as “After 3 months, what does your model say will be the cost of the
three plans?” help us gauge whether or not students understand the
connection between the model and the scenario.
- Scott Miller suggests pausing on Screen 4 to have students discuss and explain the change in scale that they made. This allows students that found an answer without using the graph to see another way of thinking that wasn’t accessible to them before changing the axes. Jade White points out that students may also make different decisions about what x and y represent, so discussing the graph on this screen can be especially illuminating.
-
Paul Jorgens offers ideas around
how to proceed when students need additional support. His strategy is to get
two groups with different responses together and have them reason it out.
“It might be a time to huddle with some groups as they work. In closure, I
think I would mock up a misconception (or 2) on a preview of screen 4 and
reason together with the class and then end sharing thoughts about best plan
on Screen 5.”
Screen 5
-
Nick Corley would give his
students a chance to debate their answers, and to discuss if there is a
right or wrong answer. Using the dashboard to select and sequence student
responses can be powerful in facilitating this discussion.
Screen 7
-
Jade White shares that her priority conversations would be on slides 5 and 7
around a deeper understanding of systems of equations and the significance
of the intersection point. Screen 7 ties everything together by having
students identify the slope and y-intercept and their significance as well
as graphing two lines that have a specific intersection point.
These are just some of the ways that a teacher can play an active role in shaping student learning during a digital activity. What are some other teacher moves we might consider in this activity and in others? Let us know on Twitter @desmos.

