Explore this graph

Des-blog

Recent Posts

Friday Fave for December 16

This is the last Friday Fave for 2016, as the Fave and colleagues are taking some time to rest and recuperate in preparation for a new year, new features, new activities, and above all new learning.

2016 finishes with a recently upgraded activity that began life as a really nice set of challenges from Lauren Olson, and is now a substantially different beast incorporating the best of what we’ve learned in a year-and-a-half of Activity Builder lesson design. The Friday Fave points you to Circle Patterns.

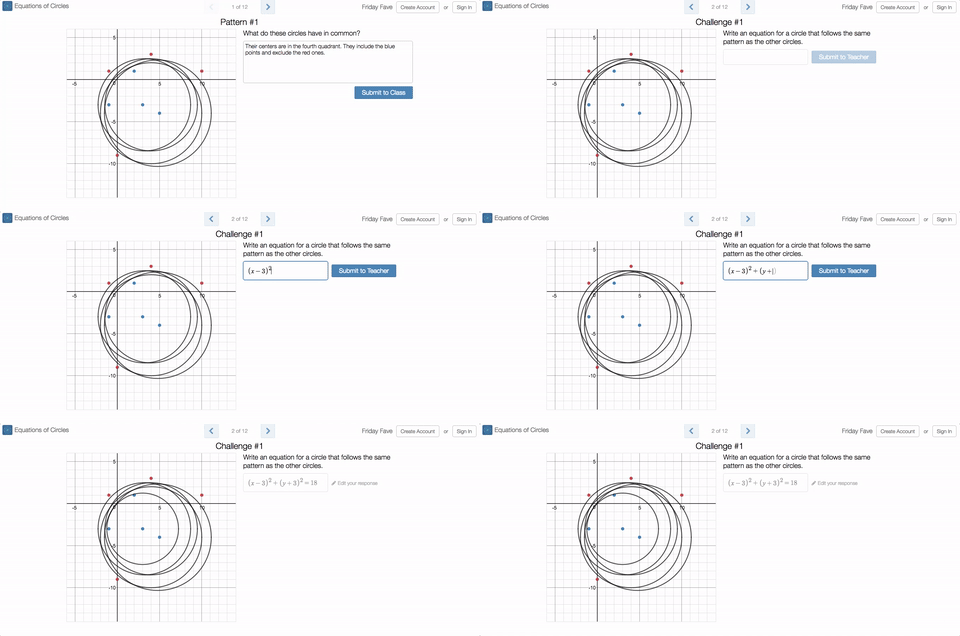
In the original, students were given the task of writing equations for circles that include some points and exclude others. The update asks students what a set of circles has in common, then challenges them to graph a new circle that also has this characteristic.
image

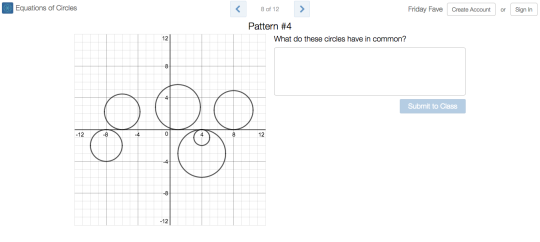
We vary the properties of the circles in ways that give students interesting things to notice, and classrooms interesting things to talk about. (The Friday Fave was delighted to notice itself stopping and thinking for a while about what these circles might have in common, for example.)
image

Legitimate challenges that students can view, and then solve, from several perspectives make Circle Patterns a true Friday Fave.

Linear Modeling: Which Do You Prefer?

In our most recent fellow’s prompt, we asked the fellows to compare Lego Prices and Are People Waiting to Get Married?. Our discussion highlighted values and unique perspectives, helping us to develop common ideas around what makes a good Desmos activity. Many of the fellows highlighted elements of the Desmos guide for building activities as they compared the activities, while others focused on the objective and how their students would relate to each context.

Incorporates a Variety of Nouns and Verbs

  • Heather Kohn, Linda Saeta, and Paul Jorgens noticed that both activities incorporate a variety of nouns and verbs. Over the course of each activity students are asked to predict, sketch, build a model, use an equation or graph to answer questions about the context, interpret parameters, and to reflect on their thinking.

Create Problematic Activities

  • Bob Lochel acknowledges that both activities allow students to connect representations effectively, but thinks that Lego Prices does a better job of developing need to connect the data and graph to an algebraic expression. Using the computation layer then personalizes the experience for students, builds informal practice, and allows students to take ownership of next steps.
  • Nathan Kraft also comments on the way that Lego Prices connects student thinking throughout the activity with a central problem, and notices the absence of this in Are People Waiting to Get Married?. “We really did something with those initial guesses [in Lego Prices] thanks to the computation layer. With Marriage, we’re asked to guess a median age in 2010, but then that never really comes up again, unless the student remembered this question from slide 1 and feels like checking the graphs. As I was going through the activity, I wasn’t sure what the focus was (slope? intercepts? systems? linear vs. non-linear?)”
  • Anna Scholl and Paul Jorgens also note the lack of a clear problem in Are People Waiting to Get Married?, with Paul offering some ideas for how to improve the frame for the activity. “I don’t feel connected to the prediction in the opening screen. Maybe I need to be asked how old I think I will be when I get married. Maybe we can see a median of our class data and then look at some trends of real data. Perhaps a better opening question might be to ask about the speculate on the typical age for someone to get married.” Thanks Paul!
  • Michael Fenton offers his perspective on how Lego Prices does a better job with creating problematic activities.

Create Cognitive Conflict

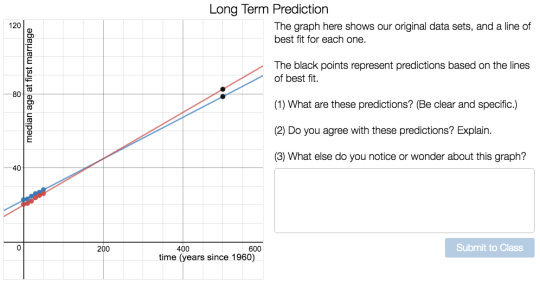
Though Lego Prices may do a better job of framing a central problem, we still have lots of love for Are People Waiting to Get Married?, which ends with this particularly compelling screen.

image
  • Nick Corley and Linda Saeta notice that extrapolation on the last screen of Are People Waiting to Get Married? drives home lots of cognitive conflict.
  • Dan Anderson notes that “I liked how the Marriage activity talked about the danger of extrapolation while the Lego activity extrapolation NAILED the prediction for the Death Star. Both are valuable lessons. The Lego extrapolation is nice because it works, and the Marriage extrapolation is nice because it doesn’t work.”

Instructional Goals

  • Anna Scholl points to the differences in prequisite knowledge for both activities, and that they each seem to have different instructional goals. Knowing the standards for the courses that you teach as well as how those standards progress throughout courses can help in determining such subtleties.
  • Heather Kohn reminds us that choosing between these activities depends on what we want students to do mathematically. In Lego Prices students will build a model with draggable points. They’ll use an automatically generated graph and equation to answer questions about the context. Are People Waiting to Get Married? asks students to build a model by hand, and use that model to answer questions. Both models are linear, but the skill involved is quite different.
  • Nick Corley, Linda Saeta, and Dan Anderson find that Lego Prices might be suitable for students in middle school both due to the y-intercept being zero and the model being built by a draggable line.

What do you consider when choosing activities? Let us know on Twitter @desmos.

Friday Fave for December 9

When the Friday Fave was a child, truck driving was the coolest possible job. CB radios, convoys, a life on the road; it seemed everyone aspired to long-haul trucking. It’s unclear whether the nature of the work has changed, or whether society has just developed new romantic notions about other lines of work. Whatever the case, the Friday Fave will always harbor a nostalgic fondness for trucks and the open road.

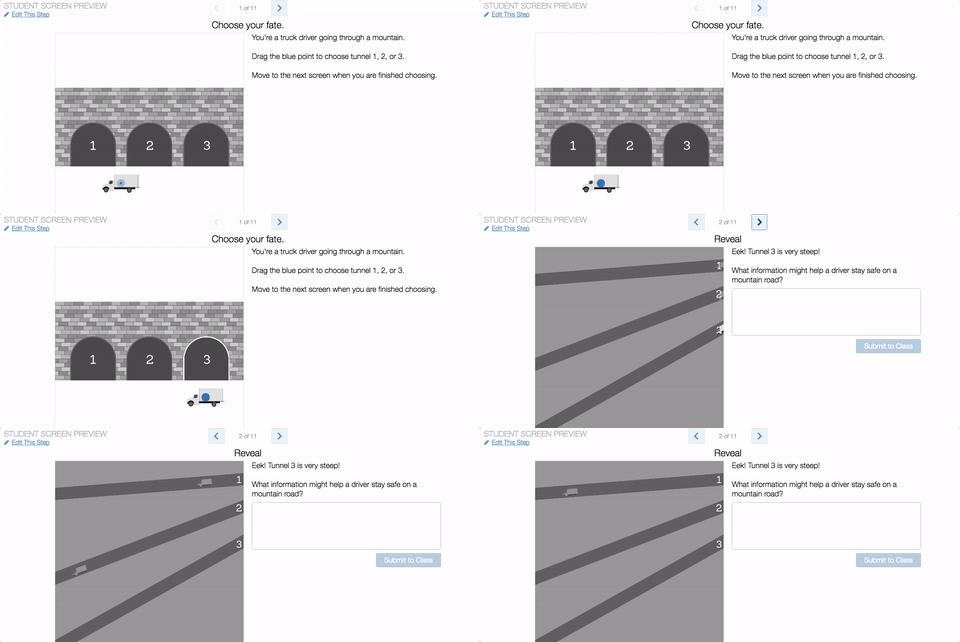
Which brings us to this week’s Friday Fave—Slanty Hills—your chance to be in the driver’s seat. Pick your tunnel, observe the consequences, and figure out how to warn the others in your convoy.

The mathematics of slopes, angles, the tangent function, and percent grade are all brought to bear on this problem of multiple representations. Students come at these representations from many different angles (heh)—they measure; they do a card sort; they put things in order.

So if you’re a person responsible for teaching angles and tangents, get your students to truck on over to Slanty Hills. Maybe it’ll be your new Friday Fave?