Explore this graph

Des-blog

Recent Posts

Friday Fave for November 11

At Desmos, we are big fans of Open Middle problems. So we’ve tried our hand at cooking up a Desmo-fied version, Smallest Solution, which is this week’s Friday Fave.

Here is a short list of things we love about Smallest Solutions.

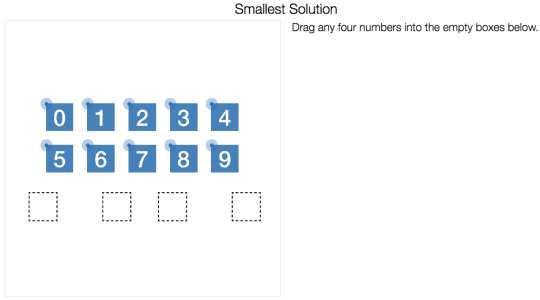
1. It is easy to get started. Drag four digits into four different boxes.
image

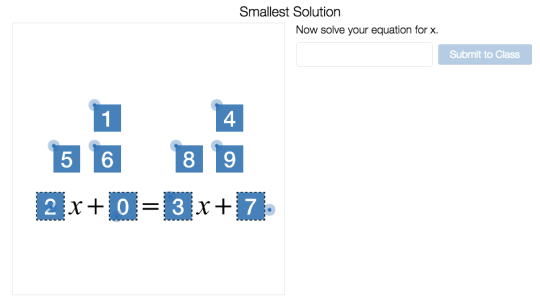
2. Things quickly become interesting. Your digits are now constants and coefficients in a one-variable linear equation which you are challenged to solve.
image

3. Only now is the namesake challenge revealed—Find the smallest solution.

We’ll let you know whether you have the smallest solution in your class or someone else has found a smaller one. But we won’t tell you who, nor will we tell you whether anyone has found the smallest possible score—that’s a job for you and your classmates to do.

Is zero possible? How do you know? From dragging a few digits to building mathematical arguments in four short screens.

Tell us what you think about our initial treatment of an open middle problem. You just may convince us to build more of them, and perhaps see these in a future Friday Fave.

Fellows’ Lounge for November 8

This week we invited the fellows to share ways that they are using Desmos for assessment purposes. While many had never used Desmos for assessment, those who had did so in unique and interesting ways. Some examples include:

  • Gerald Smith and Paul Jorgens have considered Desmos for part II of a test, where the topics aren’t as easily assessed on paper. Such is the case for problems that involve analyzing a set of graphs or creating graphs as part of a more open ended problem.
  • Serge Ballif teaches a course that uses Desmos for all exams. Students in his class spend very little time on the mechanics of solving equations, because Desmos will solve for them. Instead the class focus is on setting up equations and models and interpreting solutions.
  • Projects! Sarah Blick Vandivort has her students using Desmos to produce a graph as part of a project on linear systems. Linda Saeta, Anna Scholl, and Jade White have used Des-Art to assess student understanding of equations of lines and other function transformations.
  • Tony Riehl’s students completed their first semester final exam review on Desmos. Access to data helped Tony determine areas where students needed additional review.
  • Nick Corley has considered designing activities to help students practice for the PARCC exam.

Nolan Doyle pushed us mid-discussion to consider why we are using Desmos as an assessment tool, and to be purposeful in choosing ways to incorporate it. He wants his students to view Desmos first and foremost as a tool to help them explore math and make discoveries on their own, and wonders if students may view Desmos differently if used on assessments.

Some of the fellows are using Desmos on both formative and summative assessments in order to collect and learn from the data. Paul Jorgen’s PLC routinely uses data from activity builder dashboards to assess student understanding of topics and decide on activity revisions and next steps. Scott Miller noticed through looking at data that analyzing the graph responses helps clarify what misconceptions students have around more open ended tasks.

Even with the ease of collecting data, many of us wondered about logistics. Julie Reulbach shared her midterm with us, which included a mix of responses submitted on paper and on Desmos. Another idea for logistics and test security was to keep test problems on paper and have students submit answers only in a Desmos Activity.

What ideas have you tried? Let us know on Twitter @desmos.

Friday Fave for November 4

Playing Catch Up is a modern update of Tortoise and Hare. Sportscaster Rich wears a suit and plays the role of Hare. Wide receiver Julio surprisingly plays the role of Tortoise, but only because the magic of video has slowed him to half speed.

Who will win this Des-race?

Students predict when (if ever) Rich catches half-speed Julio. We invite them to consider how graphs, tables, and equations provide different kinds of information, and are useful in different ways for making this kind of prediction.

The part of the lesson that excites us the most is the reveal, which again takes advantage of our new video tool in Activity Builder. Students watch the finish of the race, and see whether/when Rich cases Julio.

We do not tell students the answer (and neither should their teacher)!

Instead, we give them the video evidence and invite discussion and argumentation. If less than 80% of classroom discussions of this screen offer the opportunity—the need—to discuss Zeno’s paradox, then the Friday Fave will eat its Desmos sunglasses.

Not only do we delay feedback on the correctness of students’ work, we use the moment of giving feedback to spur further conversation.

Give this activity a whirl with your algebra students and report back on how it goes.