Friday Fave for October 7

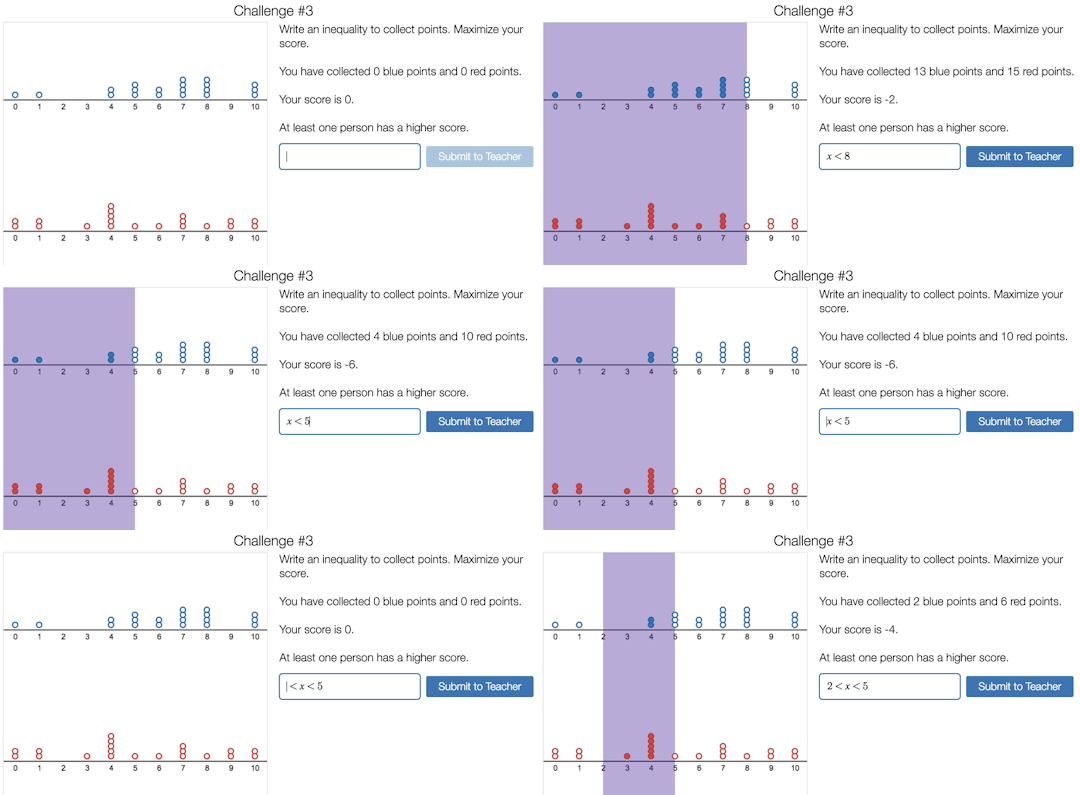
There are two reasons why Point Collector is this week’s Friday Fave:
First, it combines practice with strategy.
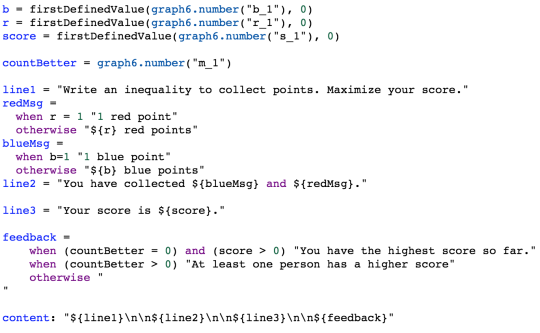
Second, it’s the first lesson we’ve released with our “Computation Layer” technology.
Practice
Practice is an important part of a math education. Some practice is totally dreary, though. (You know what we’re talking about.) Our preferred form of practice has students repeating the same operations in the context of some larger strategy.
For example, in Point Collector, your students will practice writing lots of inequalities, but always in the context of the goal of capturing the highest score possible.
Computation Layer
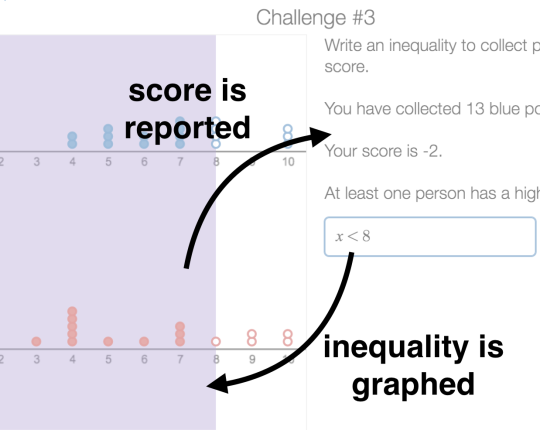
Point Collector is a more sophisticated activity than you’ve seen in the Friday Fave for a long while. Look at it! What you type in the input is plotted in the graph and the points you collect in the graph are reported in the note, along with the news that you have the highest score or that someone else in your class has an even high score, giving you fuel for continued practice.

Those connections and representations are enabled by a Computation Layer that lives on top of the activity. It looks like this:

Wild, right?!
The upside is that these internal tools will allow us to make more sophisticated activities and release them more quickly than ever before. Watch this space for more.
