
Here’s why the Desmos team (in collaboration with Dan Meyer and Christopher Danielson) made Function Carnival:
Conceptions and Misconceptions About Graphs
We know it’s important for students to connect different representations of relationships together – linking a table of values to its graph and its algebraic representations, for example. Representing and interpreting relationships between variables is an important skill even for students who do not study math beyond high school. Of all possible ways to represent these relationships, Team Desmos is partial to graphs.
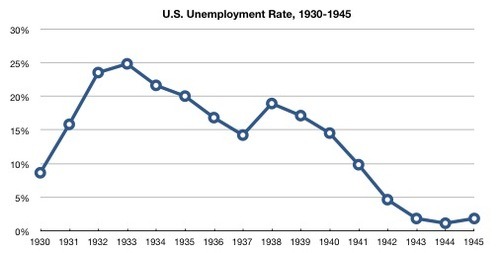
But students struggle with graphs in several ways. We have seen that students struggle with rate, and how rates are represented in graphs. In 1938, an editorial might have argued the economy was in terrible shape because United States unemployment was 17% that year. Another might have argued that the situation was getting better because yes, unemployment was high, but its rate of change was negative.
It’s often challenging for students to distinguish between (1) values, (2) the rate of change of those values, and (3) the rate of change of the rate of change.
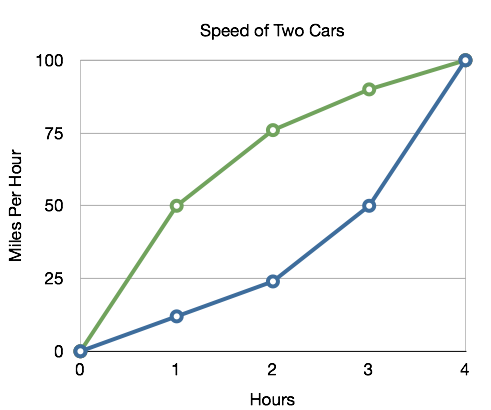
Students also tend to have the idea that graphs are pictures—that the graph always describes the position of an object in space. Given the graph below, they may think the green car and the blue car collide after four hours.
Traditional Interventions
So how do we fix this? Giving students more targeted feedback would be nice, but when a student’s graph is not a correct interpretation of the data, what are our options? We can show them an answer in a key. We can draw the right graph for them. We can have a conversation with students about different interesting wrong answers that may be representative of the entire field of wrong answers. All of these are useful strategies but they all require individual teacher intervention, which is difficult to manage in a large class.
When a student draws a graph with pencil and paper, she also has to imagine what that graph says about the world, and her imagination may be riddled with misconceptions.
Function Carnival
Function Carnival changes that. Students watch a video. They try to graph what they see. Then they play back the video and see how their graphical model would be represented as an animation. Does what they meant to graph about the world actually match the world?

They can revise quickly, erasing and re-drawing pieces of their graph.
If a student creates a graph that isn’t a function, the teacher can still tell the student, “That means the person was in two places at once,” but now the student can see all those people also.
Pair this digital feedback with a teacher who can help students understand the difference between what they thought was going to happen and what actually happened and you’re readying students for a strong understanding of graphs and their representations. Give it a try.
REFERENCES
Ball, D.L.(2003). What mathematical knowledge is needed for teaching mathematics? Prepared for the Secretary’s Summit on Mathematics, US Department of Education, February 6, 2003; Washington, D.C. Available at http://www.ed.gov/inits/mathscience
Bureau of Labor Statistics. “Graph of U.S. Unemployment Rate, 1930-1945.” HERB: Resources for Teachers, accessed November 8, 2013, http://herb.ashp.cuny.edu/items/show/1510.
Monk, S. “Representation in School Mathematics: Learning to Graph and Graphing to Learn.” In A Research Companion to Principles and Standards for School Mathematics, edited by Jeremy Kilpatrick, W. Gary Martin, and Deborah Schifter, pp. 250–62. Reston, Va.: NCTM, 2003.