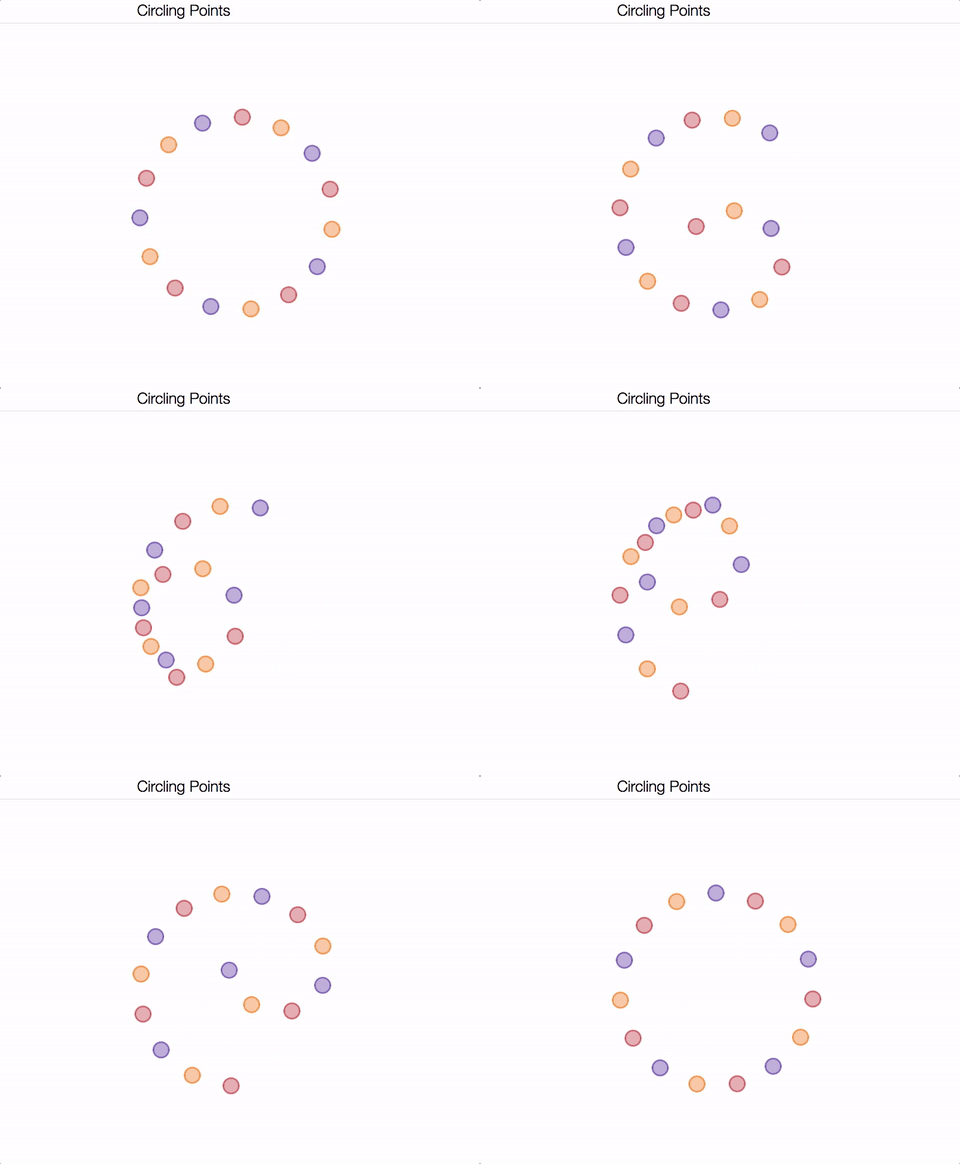
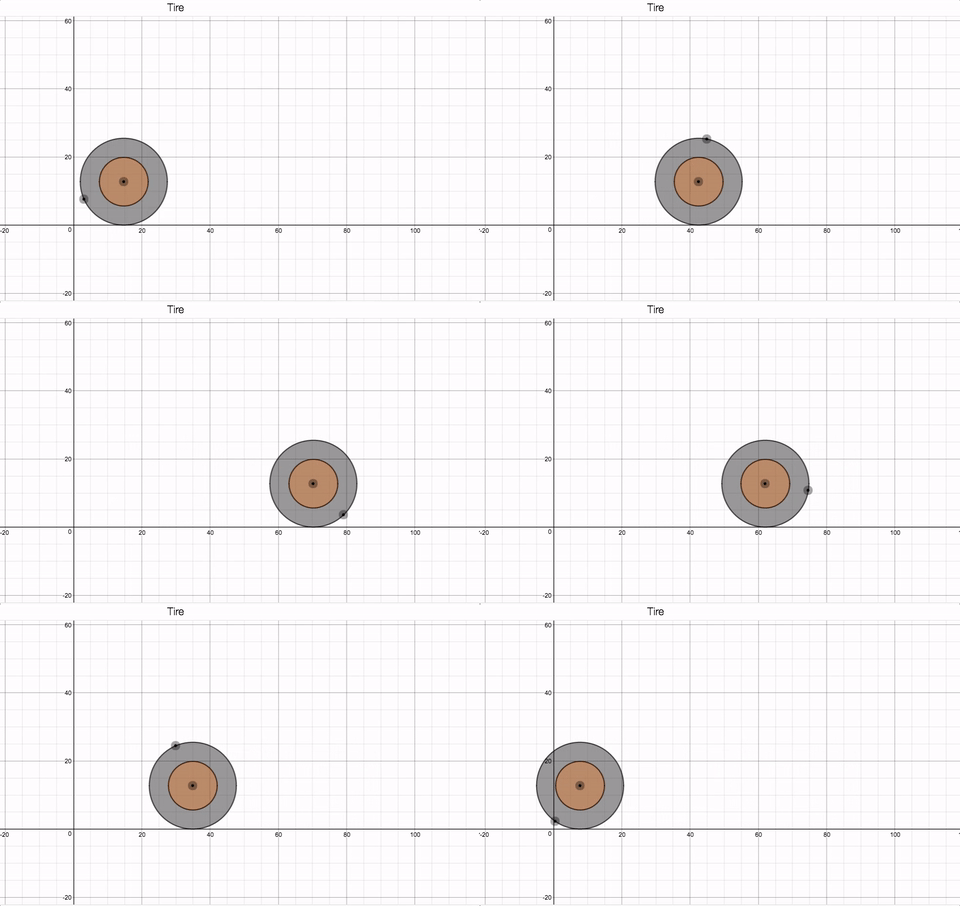
From time to time the Desmos Fellows have a Desmos Potluck, where each of us brings a dish so that we may connect, level up our calculator skills, and expand our knowledge of what is possible with the Desmos Calculator.
The Desmos Fellows and team have spent the last week preparing dishes for the latest Desmos Potluck, and we want to extend an invitation to all of our math friends.
Here’s a sample dish contributed by Suzanne von Oy. Suzanne’s dish was inspired by a blog post from Colossal that included many interesting animations.

Patty Stephens created the graph below to accompany a math task for a class in her district.

Here’s how you can participate in the latest Desmos Potluck:
- Find a graph from the activity that interests you. Try to recreate that graph. If you need support, you can ask us on Twitter @desmos or take a look at the contents of the folder. Some folders are hidden from the student view, so feel free to make a copy of the activity and check the folder contents in authoring mode.
- Let us know on Twitter which graph you recreated. What did you learn as you created the graph? Any surprises or challenges?
- What dishes can you contribute?
We hope you’ll join in the meal.
