
Several years ago, we realized that in order to have any kind of meaningful impact on a student’s math education, we needed to integrate ourselves into their daily math experience, especially their curriculum. At the same time, Illustrative Mathematics and Open Up Resources released their openly-licensed core middle school math curriculum. We loved the coherence of their curriculum, the way they told middle school mathematics like a story. We then asked 68 teachers how they liked their current curriculum using a tool called a Net Promoter Score, and Illustrative Mathematics was the clear winner.
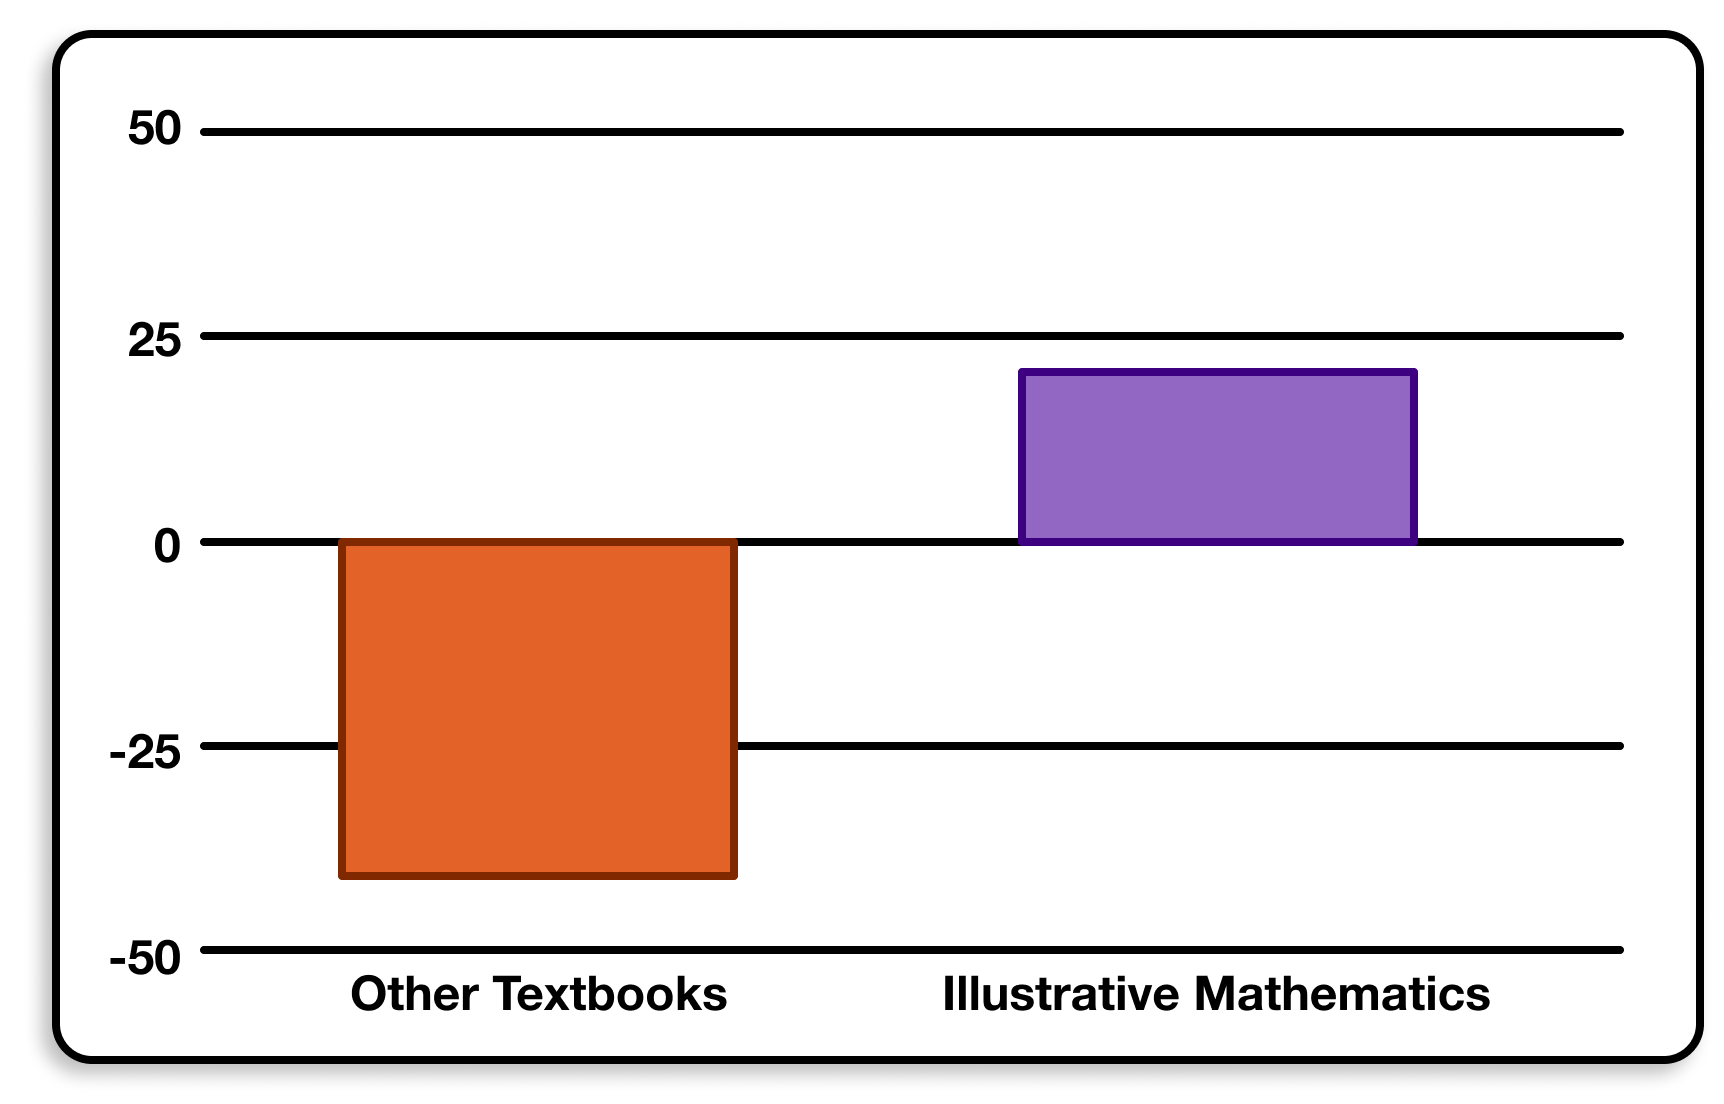
A negative NPS means more detractors than promoters. Positive means more promoters than detractors. Anything positive is considered good. 50 is considered excellent. Illustrative Mathematics was the only curriculum in our sample with a positive NPS.
But Illustrative Mathematics was built for paper. It includes a few digital applets, but they’re supplementary, not core to the student experience. Meanwhile, at Desmos, we work with paper and computers. We get to decide on the best medium for whatever mathematics we’d like to help students learn.
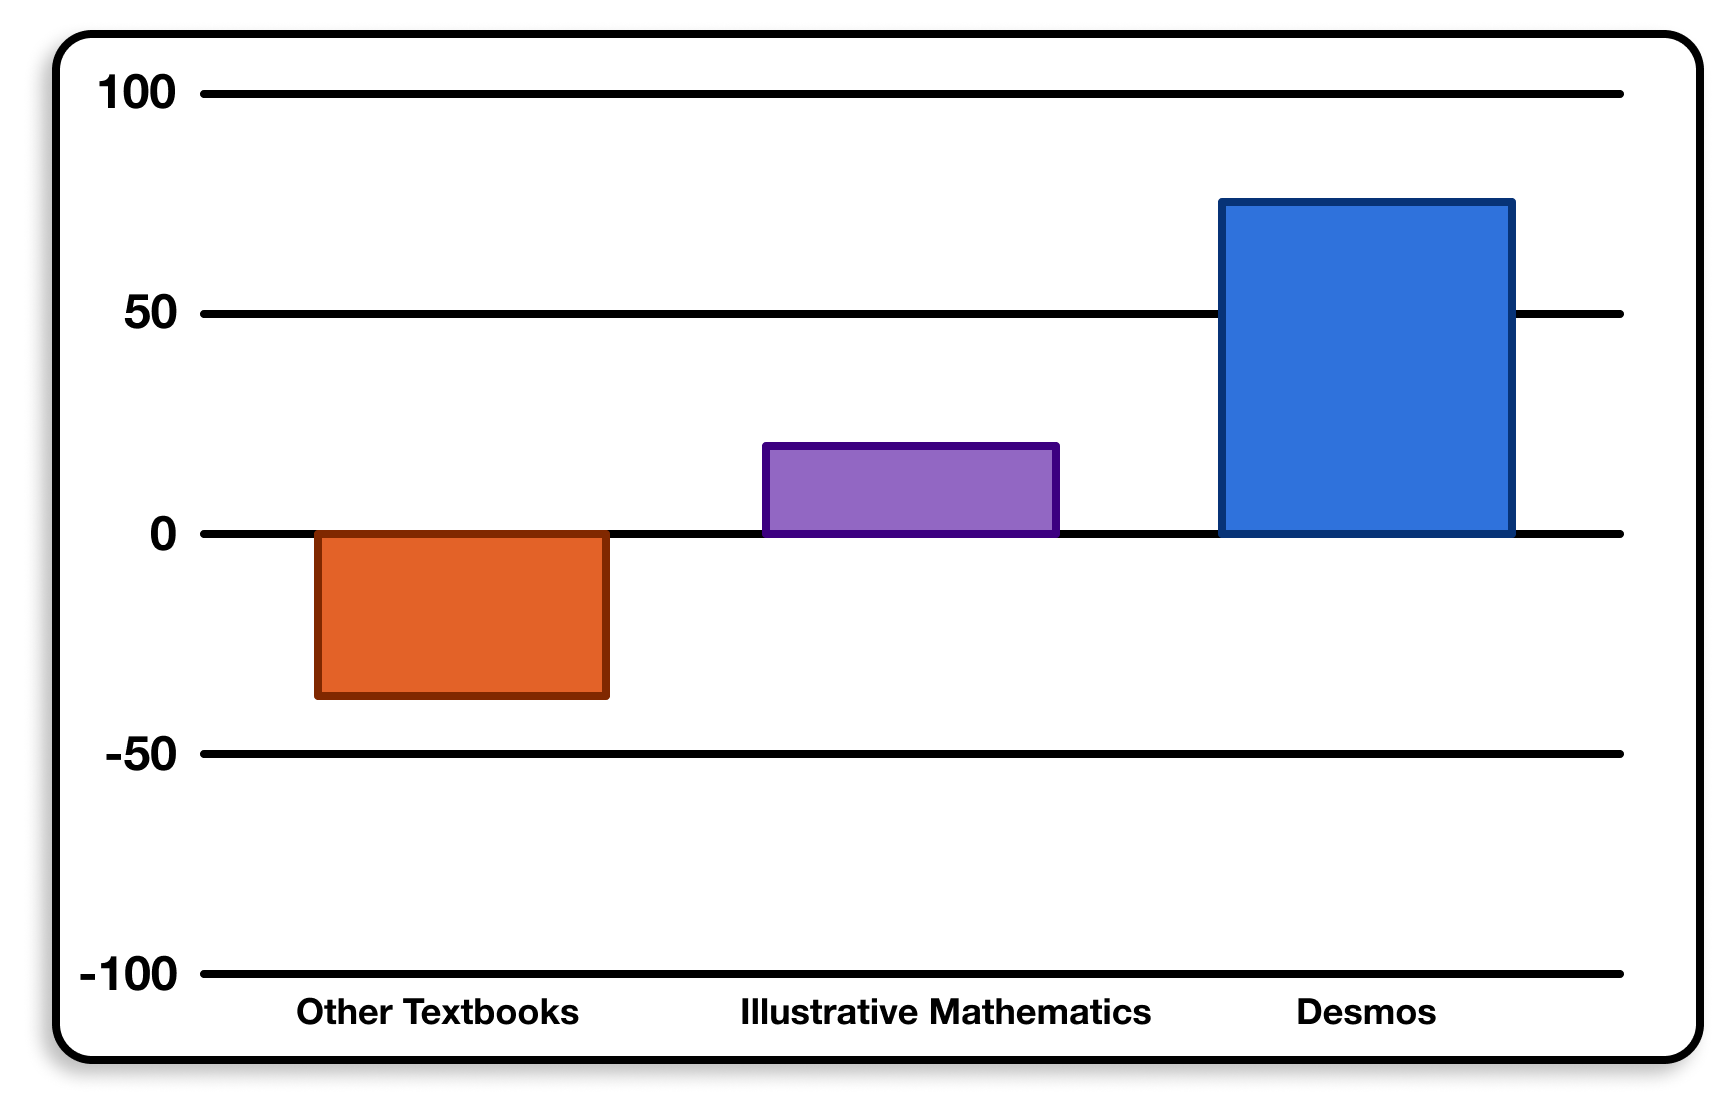
So we built a Desmosified version of an Illustrative Mathematics unit, and later, all of Grade 8. Here is how those teachers responded to the same Net Promoter Score question.
We’re very proud of those results and want to share some of the labor and love we think they represent. So, periodically, we’re going to give you folks a look inside our digital mathematics playbook.
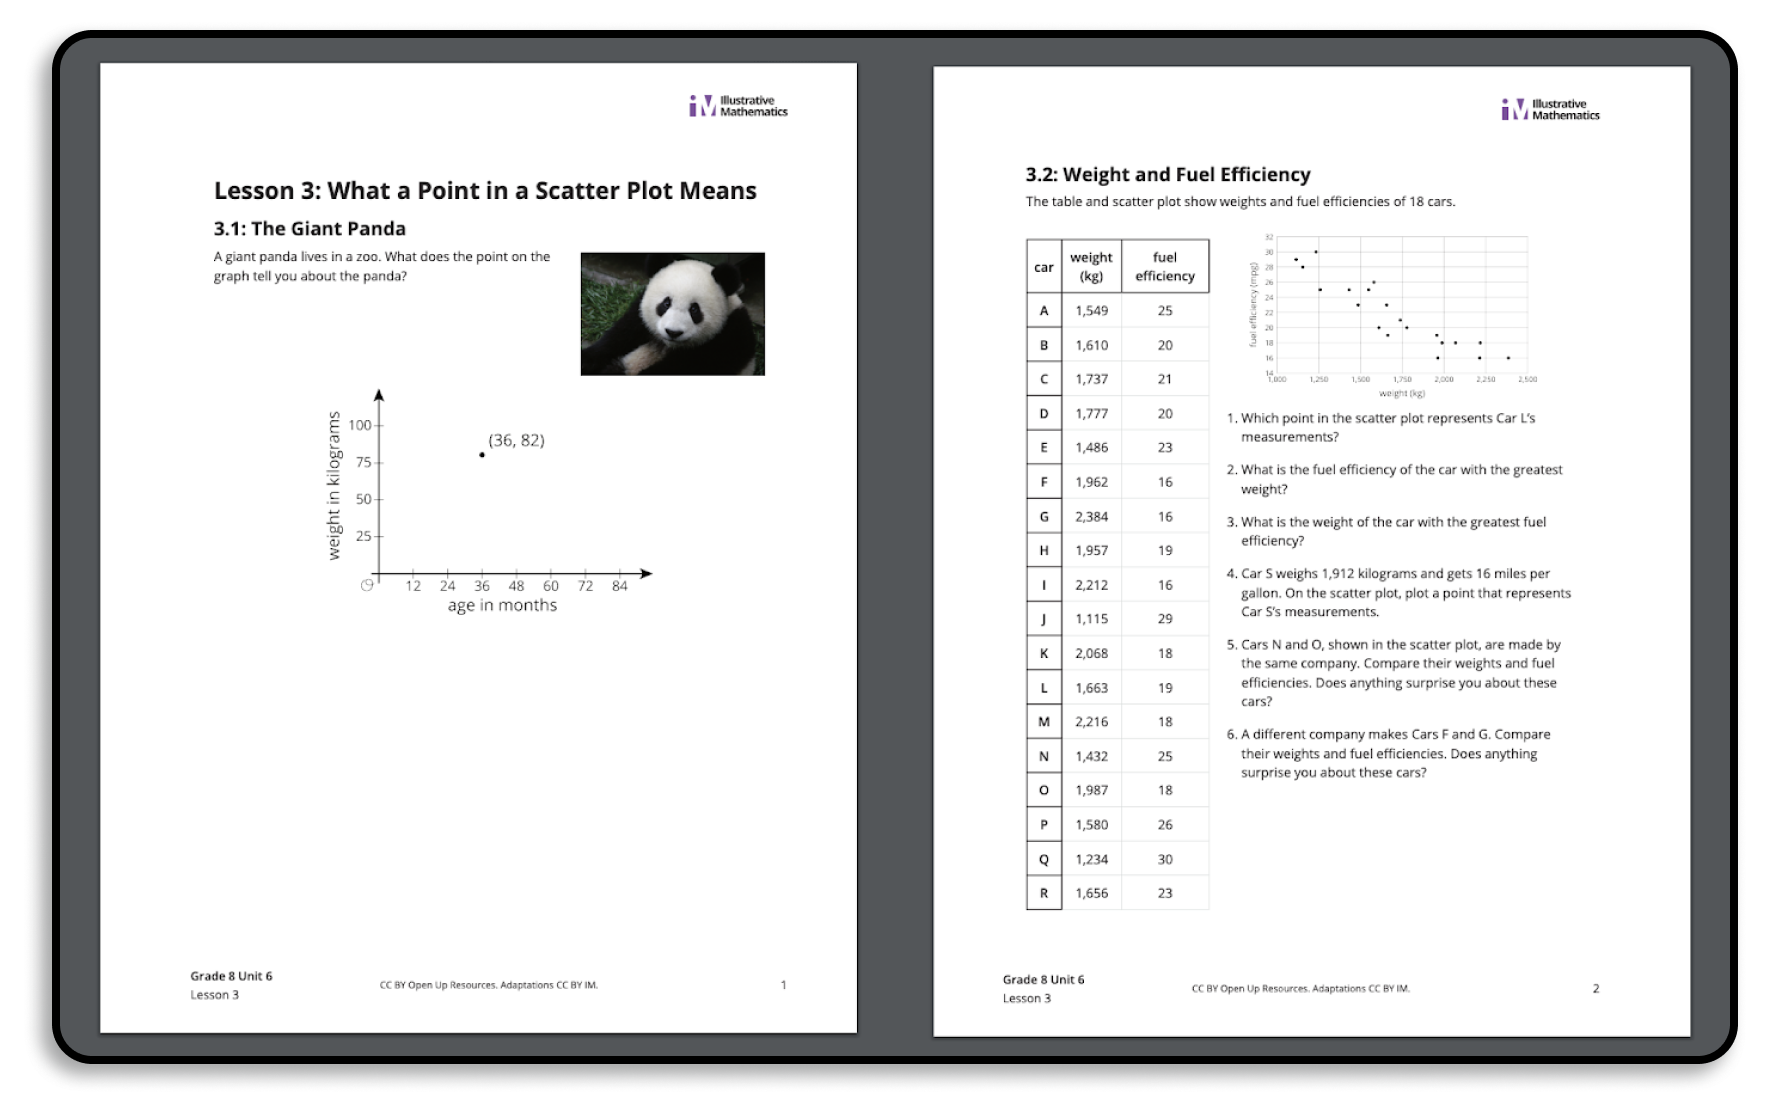
Our lesson “Robots” (use it for free!) is based on IM’s lesson “What a Point in a Scatter Plot Means.” Here’s what that means.
Desmosification #1: We use “progressive disclosure” to give students concrete experiences in math before abstract ones.
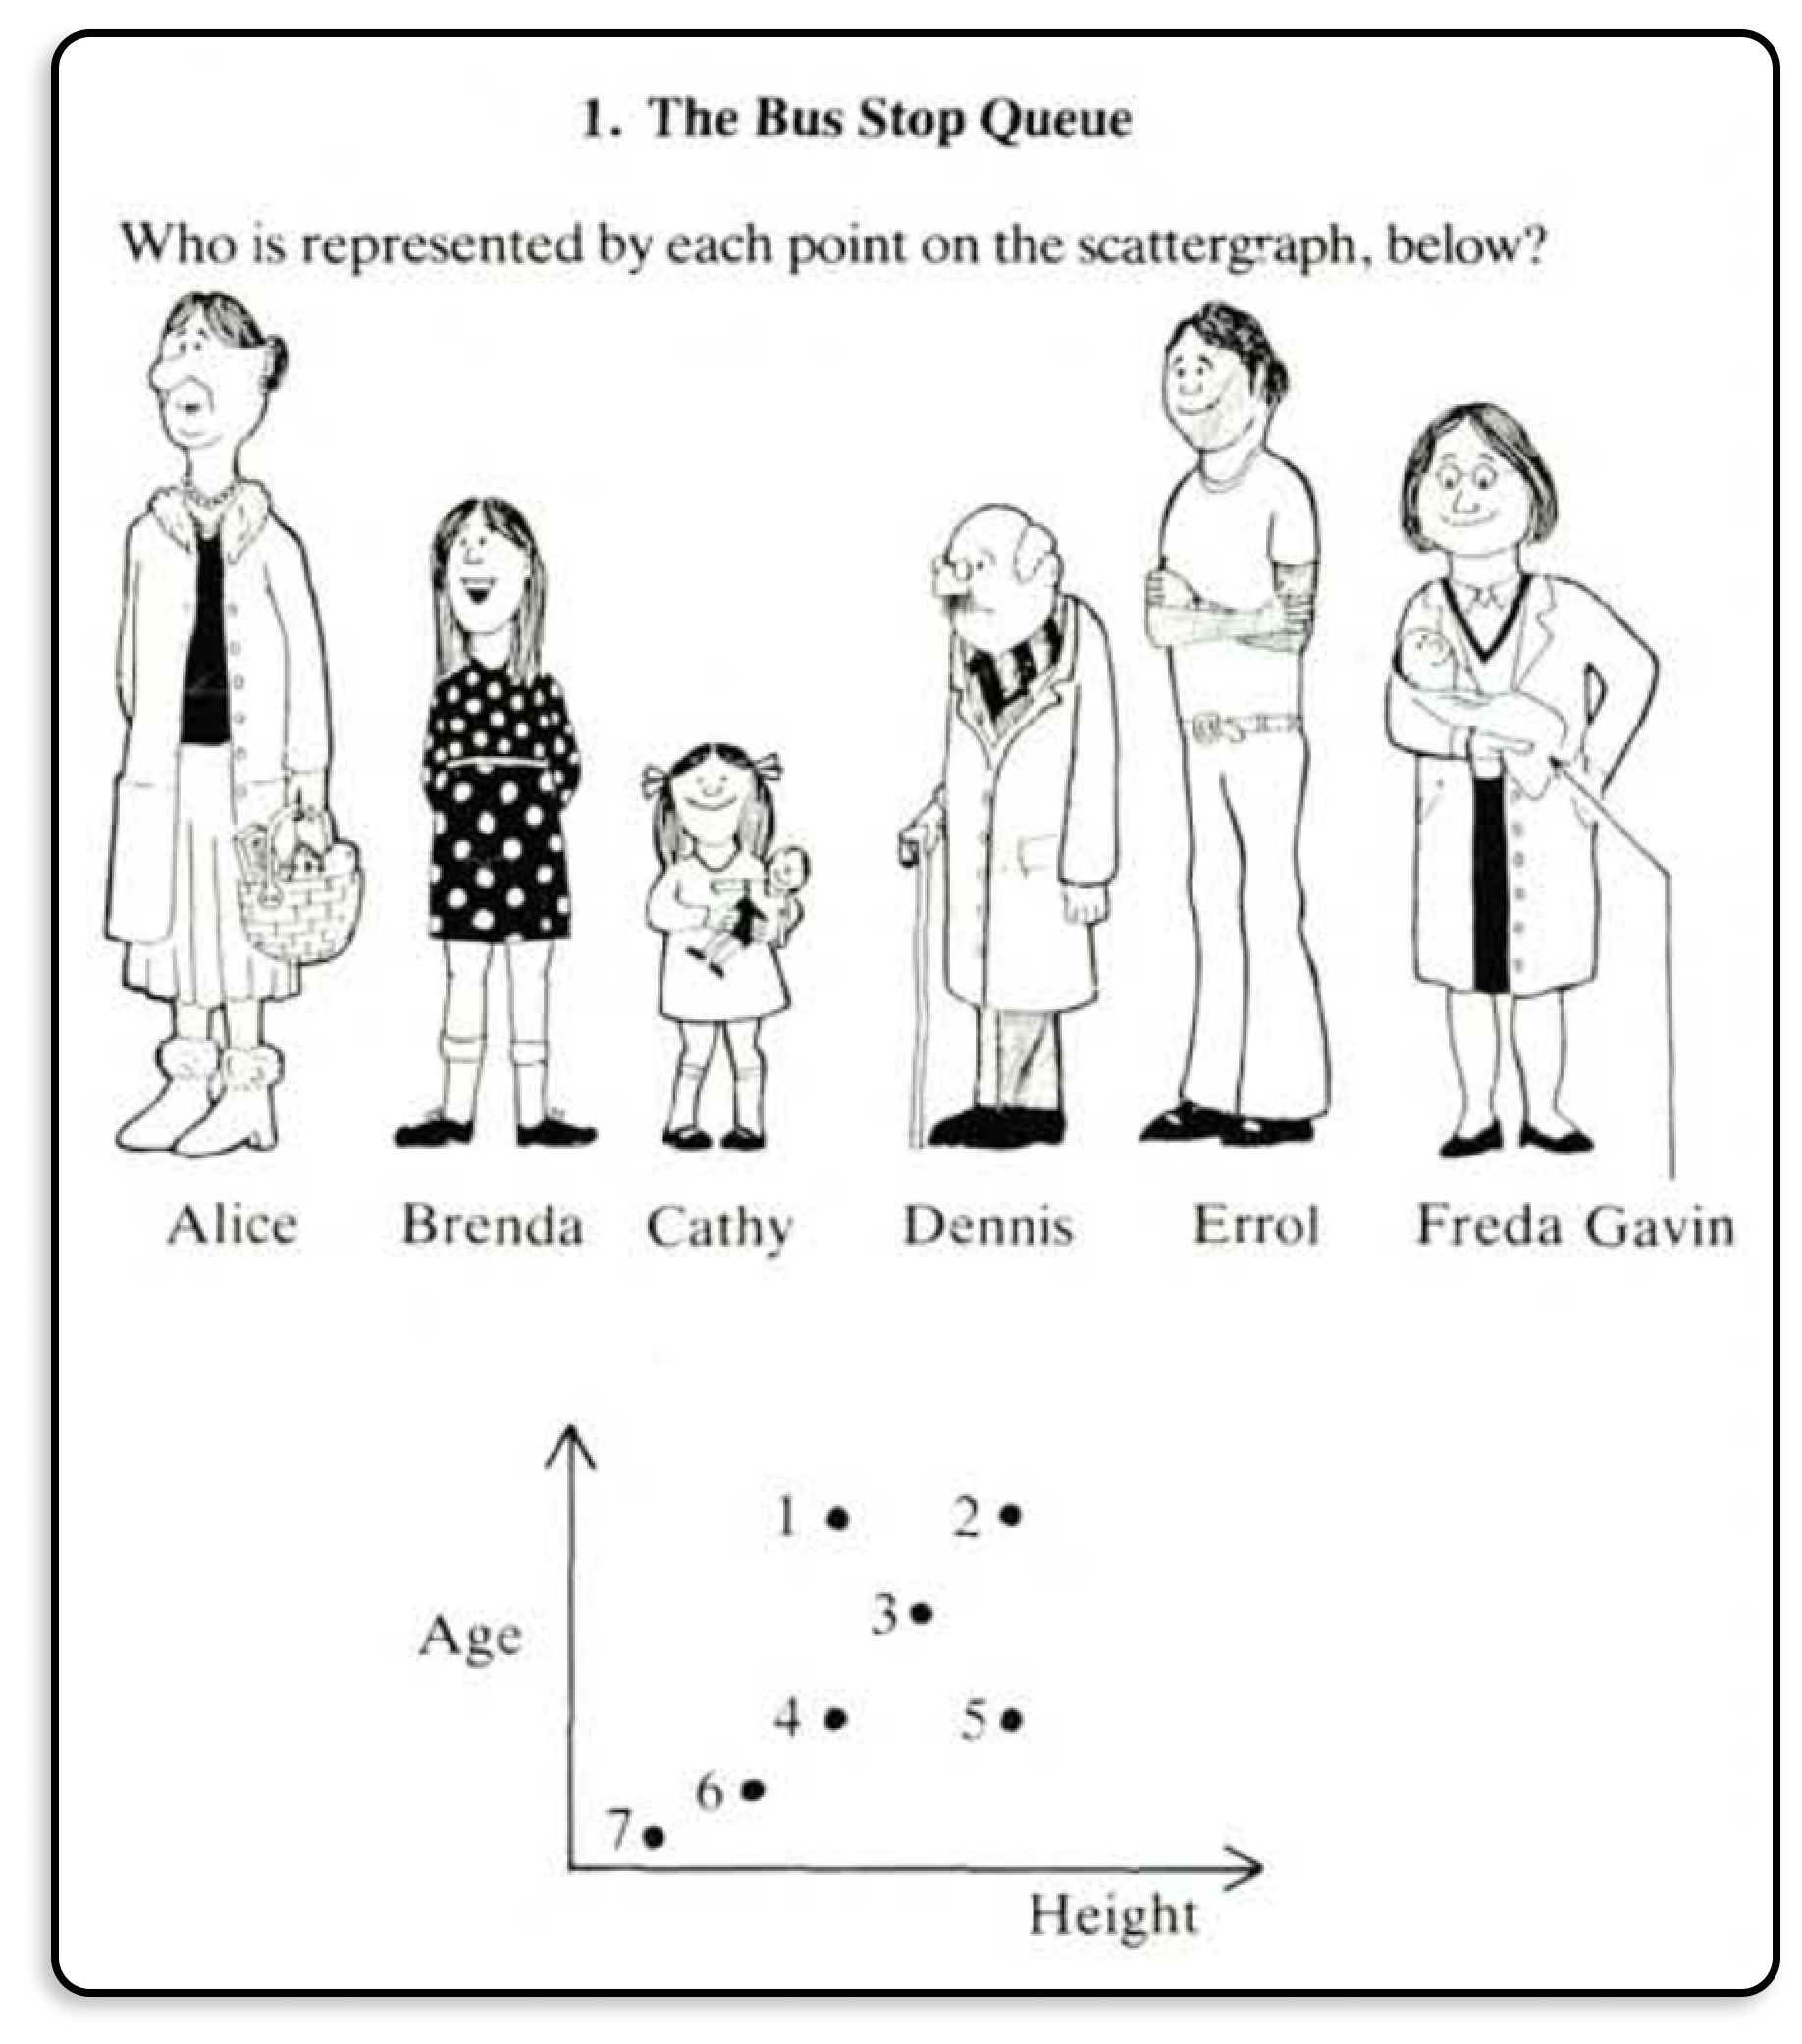
Here is how the lesson starts in the paper Illustrative Mathematics materials.
Math curricula often move students quickly to numerical precision before students have had a chance to experience mathematics in a more concrete, intuitive form first. That’s often a liability with paper. You need to put math in all of its forms on the same page.
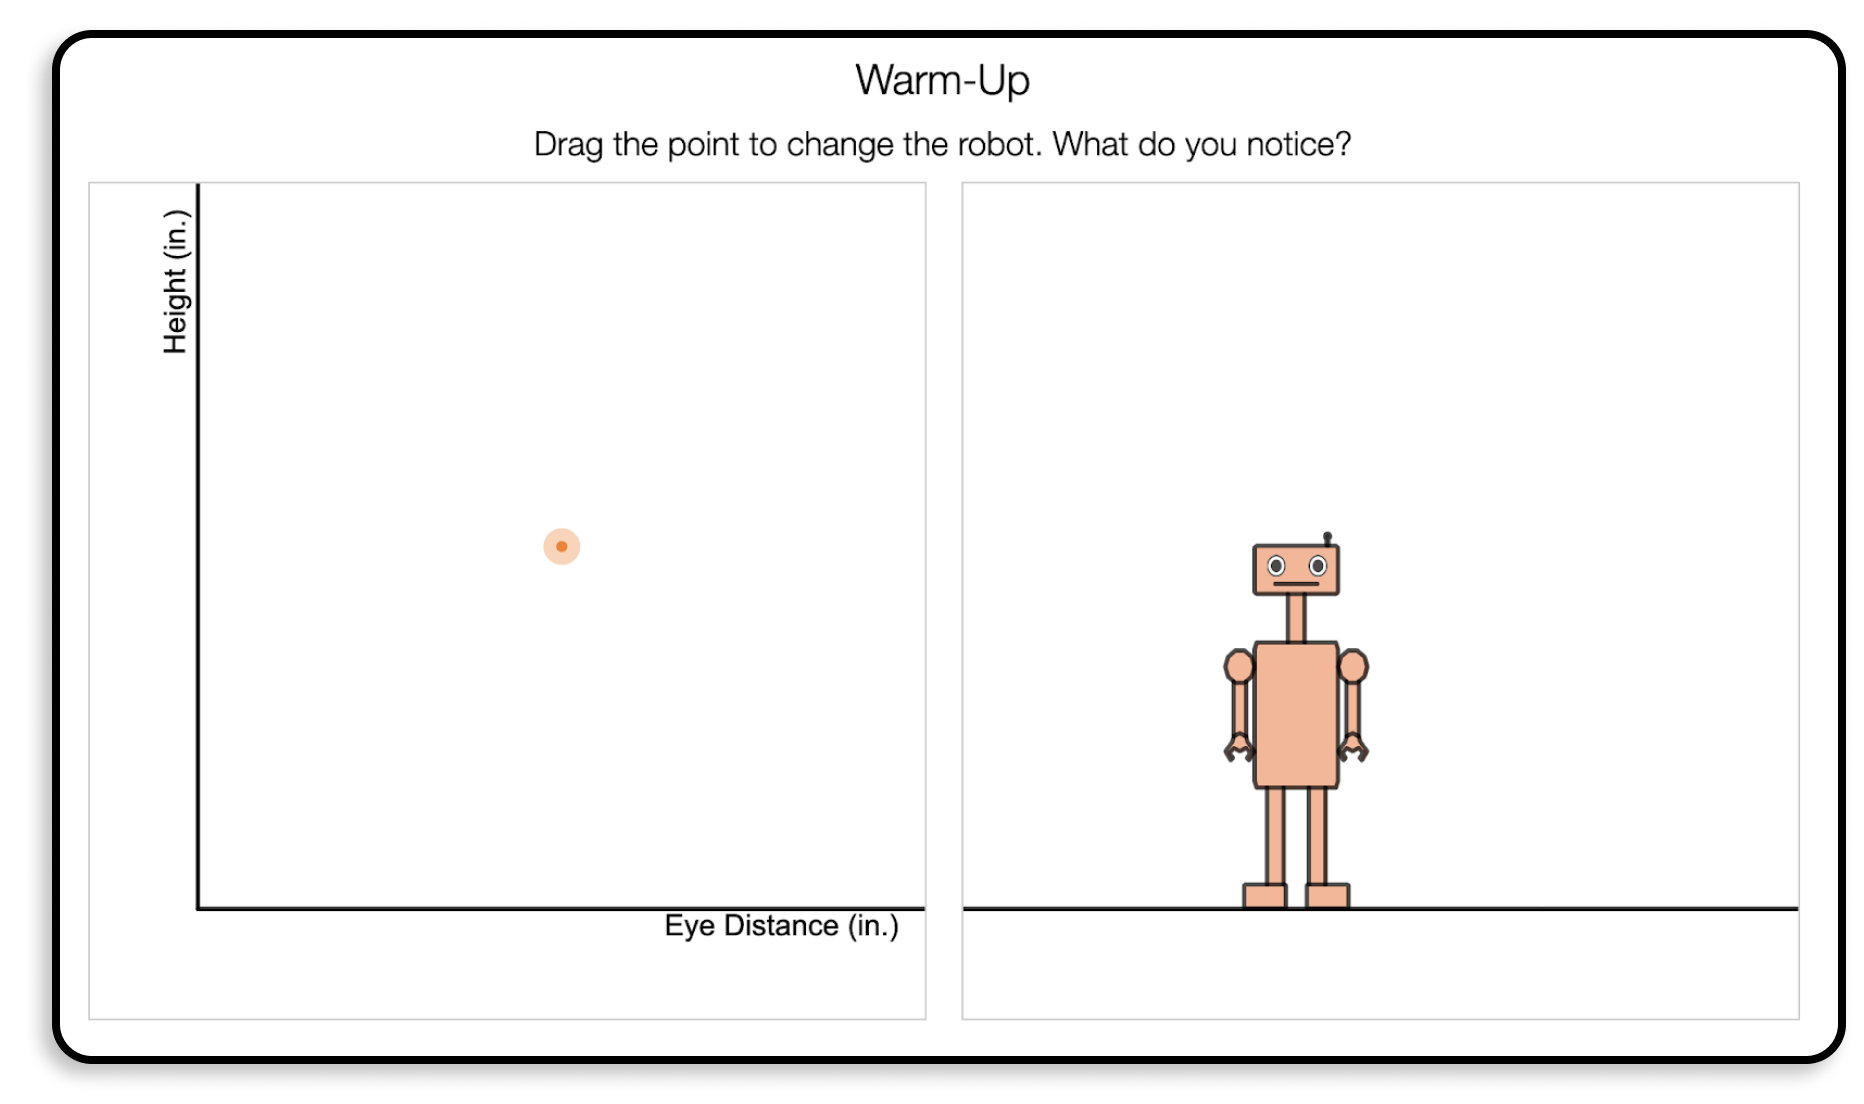
With the digital medium, we’re able to ask students questions about the graph without numbers first, questions like, What do you notice and wonder here? and then later introduce numerical precision. This invites more learners to the mathematics.
Desmosification #2: We connect the concrete and abstract representations.
All too often, computer-based math—even other computer-based adaptations of Illustrative Mathematics—fails to take advantage of what makes computers special. Sometimes they offer the same paper material only in a digital worksheet or in digital presentation slides. Other times they use a dynamic medium only to evaluate students, to tell them that their ideas are right or wrong.
Meanwhile, we have seen over and over again the power of computers to connect concrete and abstract representations of mathematics, helping students understand both.
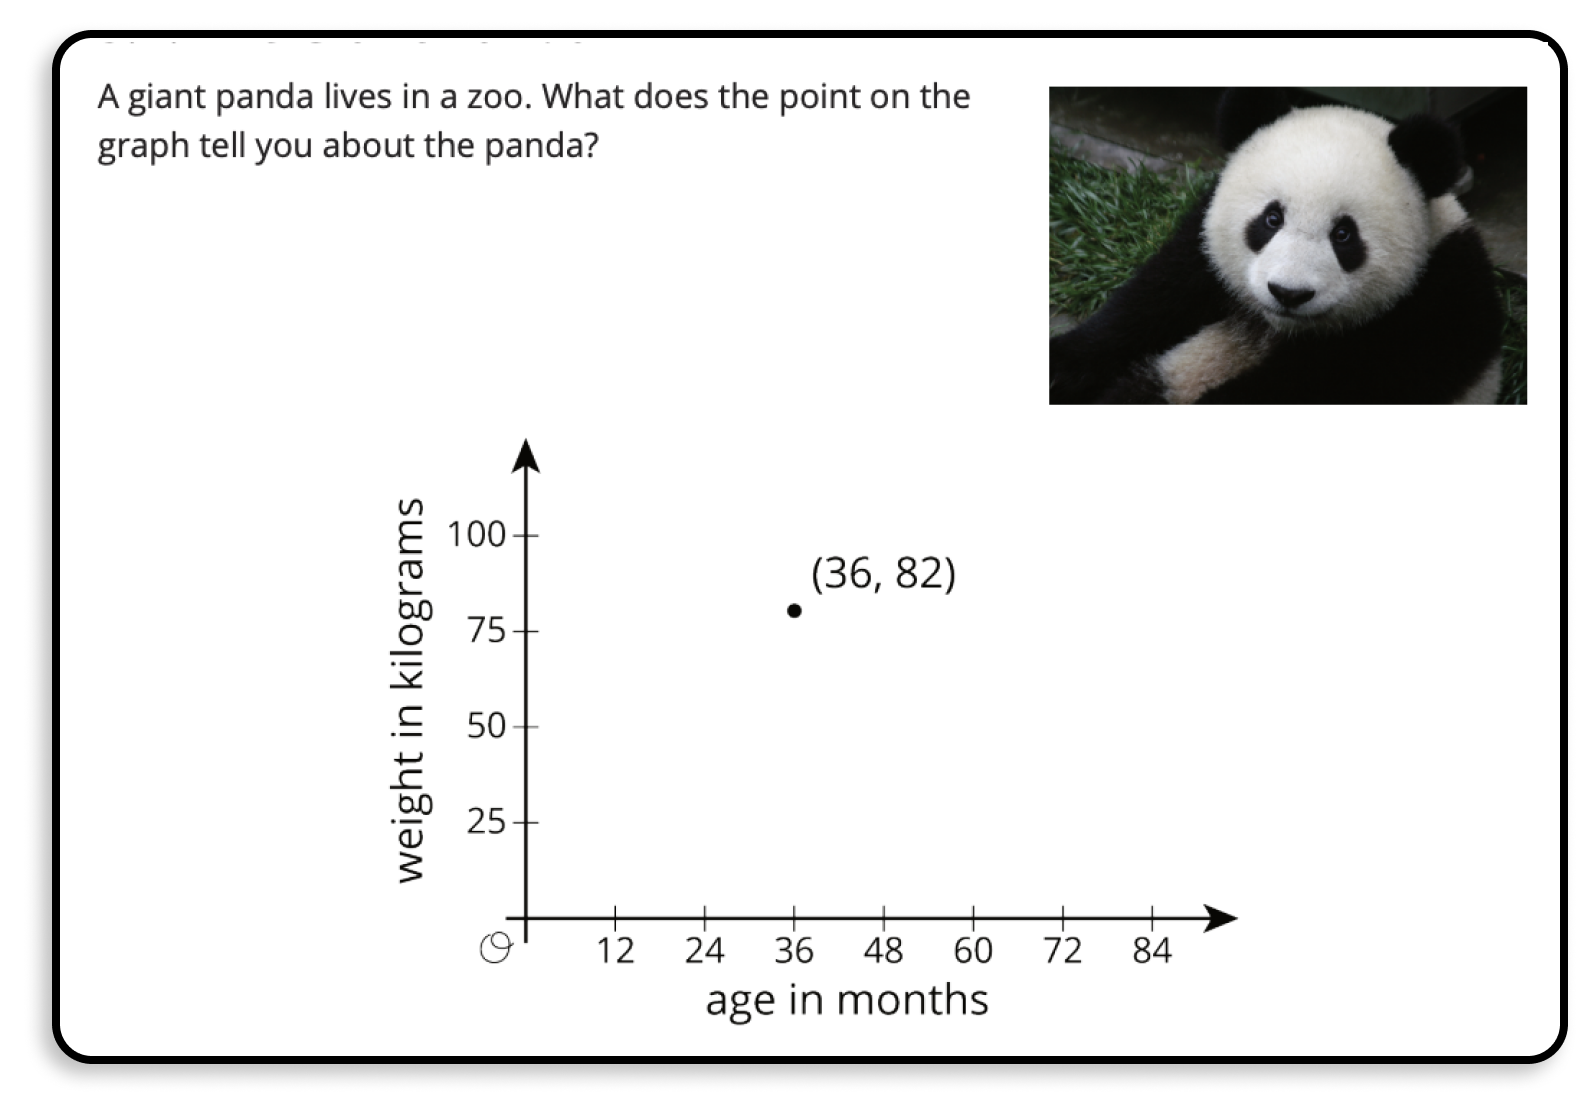
In the paper version of Illustrative Mathematics, the point (36, 82) just sits there, unchanging. In our adaptation, students move the point and make sense of a changing robot.
Desmosification #3: We give students interpretive feedback.
With paper-based math, students often don’t get timely feedback on their thinking at all.
With some computer-based math, students get immediate feedback, but it’s evaluative, a right/wrong judgment that isn’t very helpful for learning.
With the Desmos adaptation of Illustrative Mathematics, we give students interpretive feedback, showing them a) the robots they created with their points and b) how those robots compare to the robots we asked them to create. They can learn, change their work, and try again.
Desmosification #4: We support student creativity and connection.
We loved this question from the original Illustrative Mathematics lesson, which asks students to “tell the story” of a point. What a fantastic way to connect concrete and abstract representations!

Using the digital medium, we decided to a) let students choose from several contexts, b) invite students to share their stories with one another, and c) ask them to participate in one another’s story.
Students can choose from eight data sets.
They add a new point.
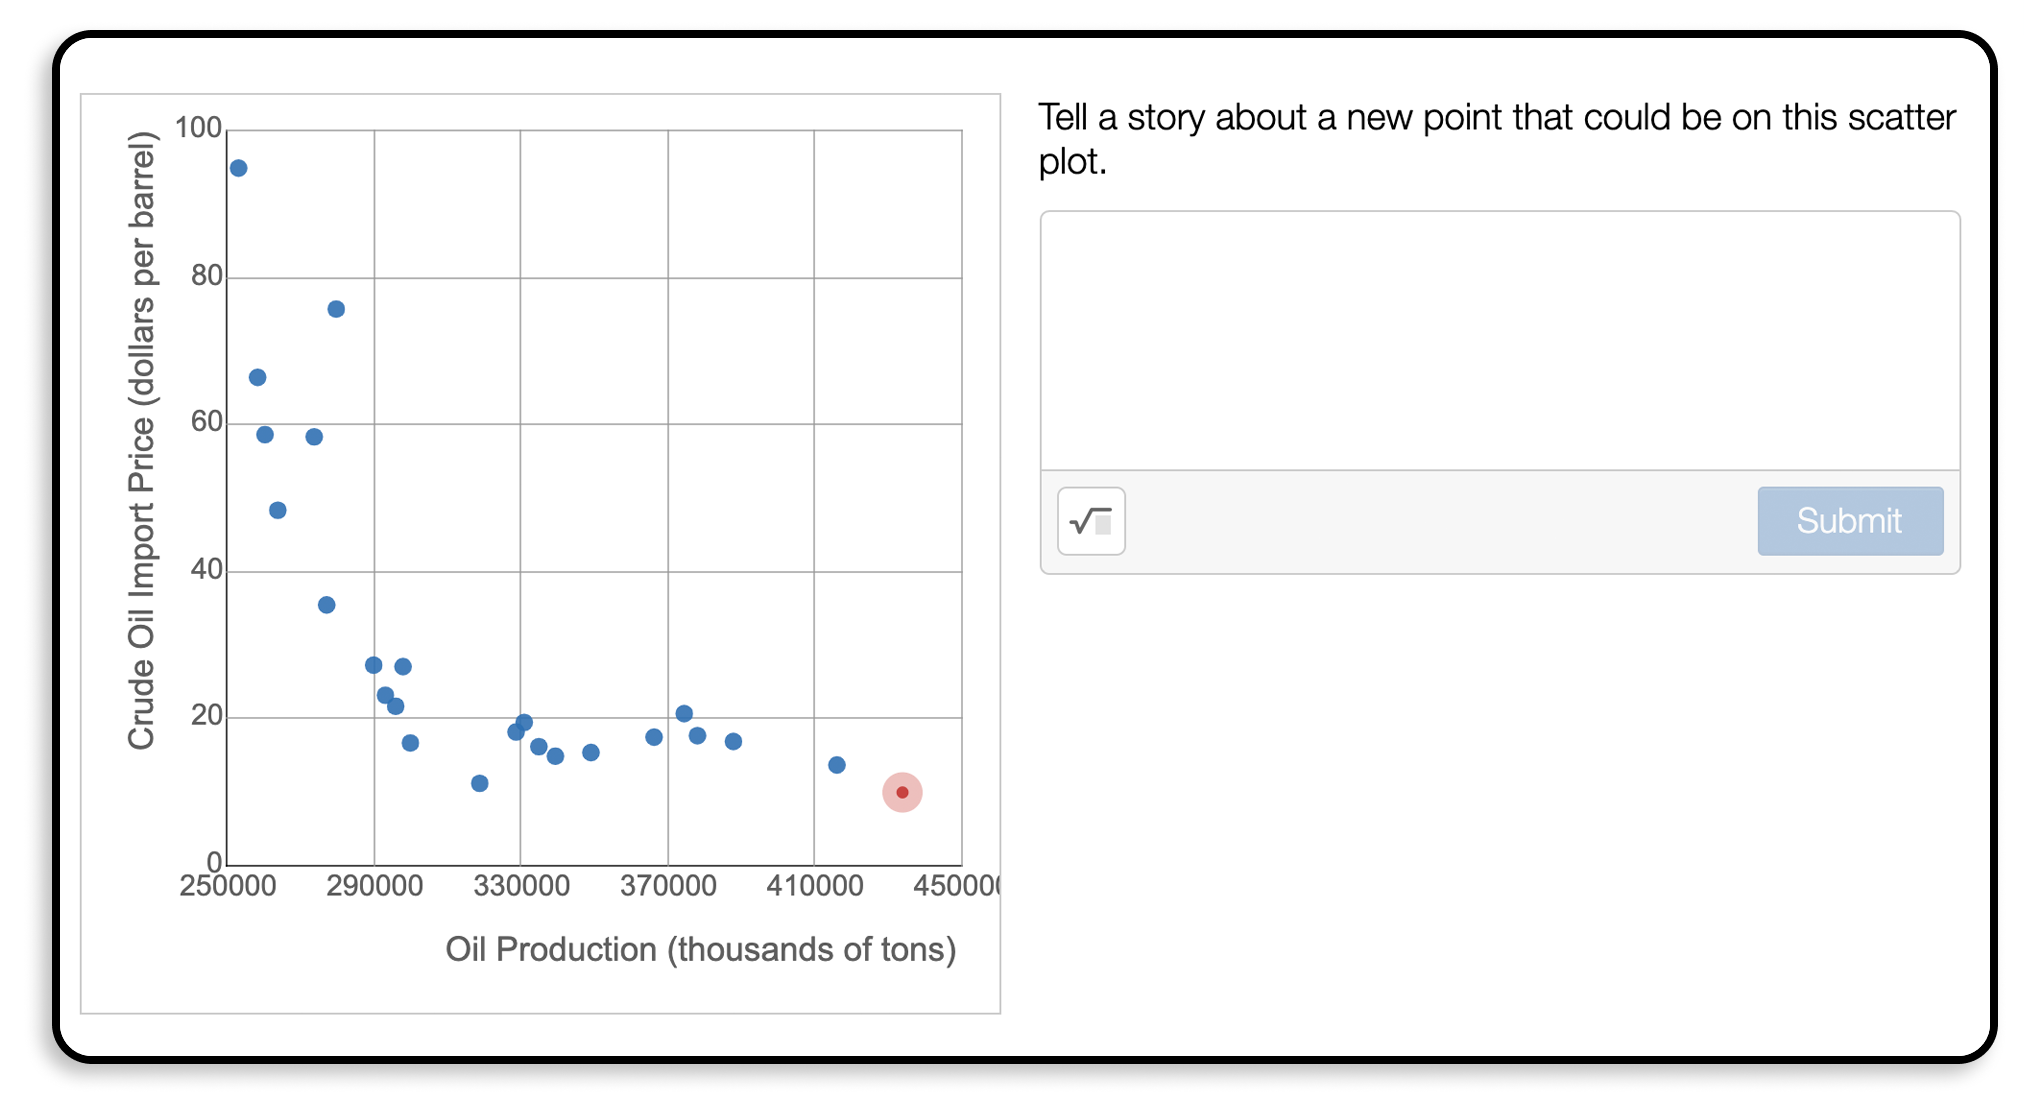
They tell a story about the point. Then, they submit the data set, their point, and their story into the “Class Gallery.”
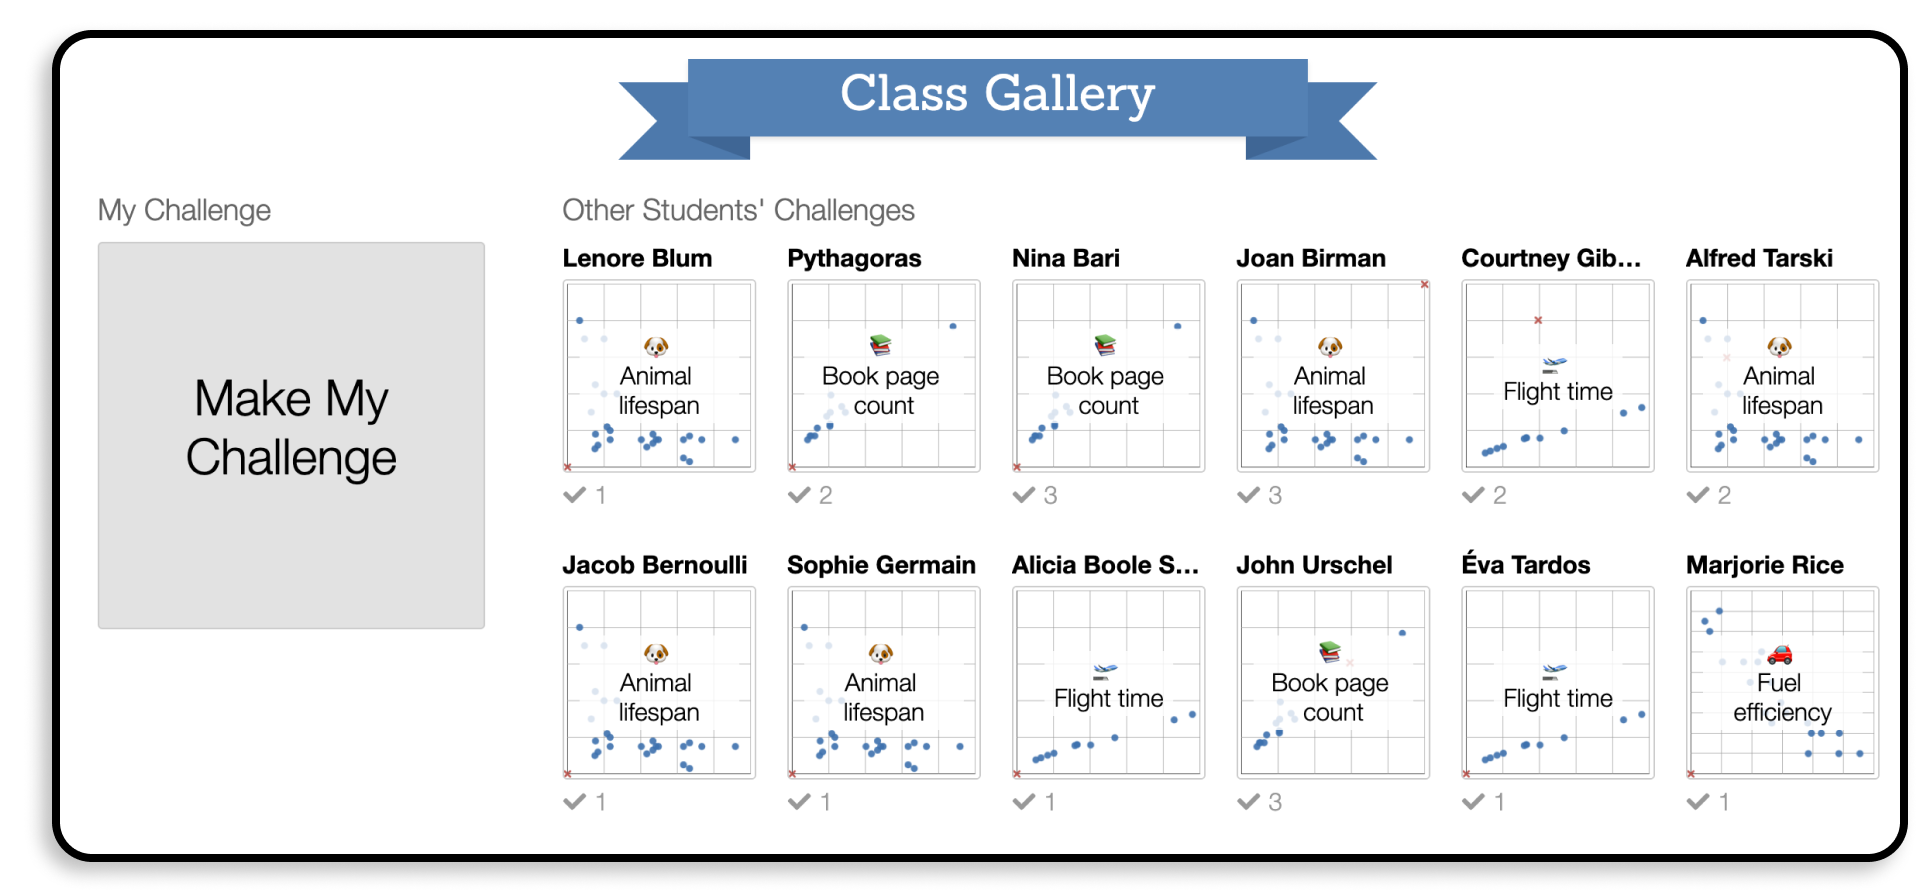
Students then work on one another’s stories, trying to match a point to their classmate’s story before seeing their classmate’s responses. This a) gives students interesting practice and repetition and b) helps them understand that they can be the authors of math problems just as much as grown-ups can.
What Did Teachers Think?
Super funny student quote that I repeated in front of the whole class after screen 1. “Look! I made a really tall cyclops!” I asked students why it looked that way when dragging the point to where he did. Good discussion.
I think students (including the inclusion students) were able to make good realizations and had good comments with the notice and wonders. Being able to see the robot grow when you check your work, it was awesome to see / hear the students ooing and ahhing. The challenges are definitely a game changer–as expected. I was able to see the students write some pretty amazing questions, allowing them to be super creative.
My students are understanding the points better than they did on the paper/pencil Illustrative Mathematics work last year.
The animated robots kept students engaged. The diversity in topics for the challenge activity gave different students different access points.
My students kept saying how much they loved this lesson. With remote learning, this was a great way to introduce scatter plots.
Behind the Scenes
Desmos lesson developer Lisa Bejarano on “robot eye distance”:
I loved the idea that each point was connected to a unique individual, and knew I wanted to leverage our interpretive feedback to help students make sense of the meaning of each point. I started brainstorming more concrete variables to put on the axes that would intuitively connect to horizontal and vertical changes. Height seemed a pretty obvious choice on the y-axis. For the x-axis, I really wanted students to have a chance to consider what it would mean if the point was on the y-axis and x=0. I initially considered body width, but decided it was not a great option, because if the width was zero, the robot would disappear. After many brainstorming calls with colleagues, we decided to use eye distance because we could visually communicate what an eye distance equal to zero would mean in the context.
Shout Outs
Aside from Illustrative Mathematics and Open Up Resources, of course, we have to shout out Malcolm Swan and the Shell Centre’s Language of Functions and Graphs. Nearly 40 years old and still dazzling with tasks like this.
What’s Next?
- Invite your students to play with Robots!
- Get activities like this every day in our core middle school math curriculum.
- Join me on Monday, Sept. 14 at 4PM Pacific to participate in Robots as a student.