
Welcome to a series of posts sharing how we #Desmosify the curriculum from Open Up Resources/Illustrative Mathematics. You can use this lesson for free, or sign up to get many more activities just like it in our core middle school curriculum!
Here’s how we #Desmosified an Open Up Resources/IM lesson to help students students interpret graphs of functions..
Desmosification #1: Create concrete connections.
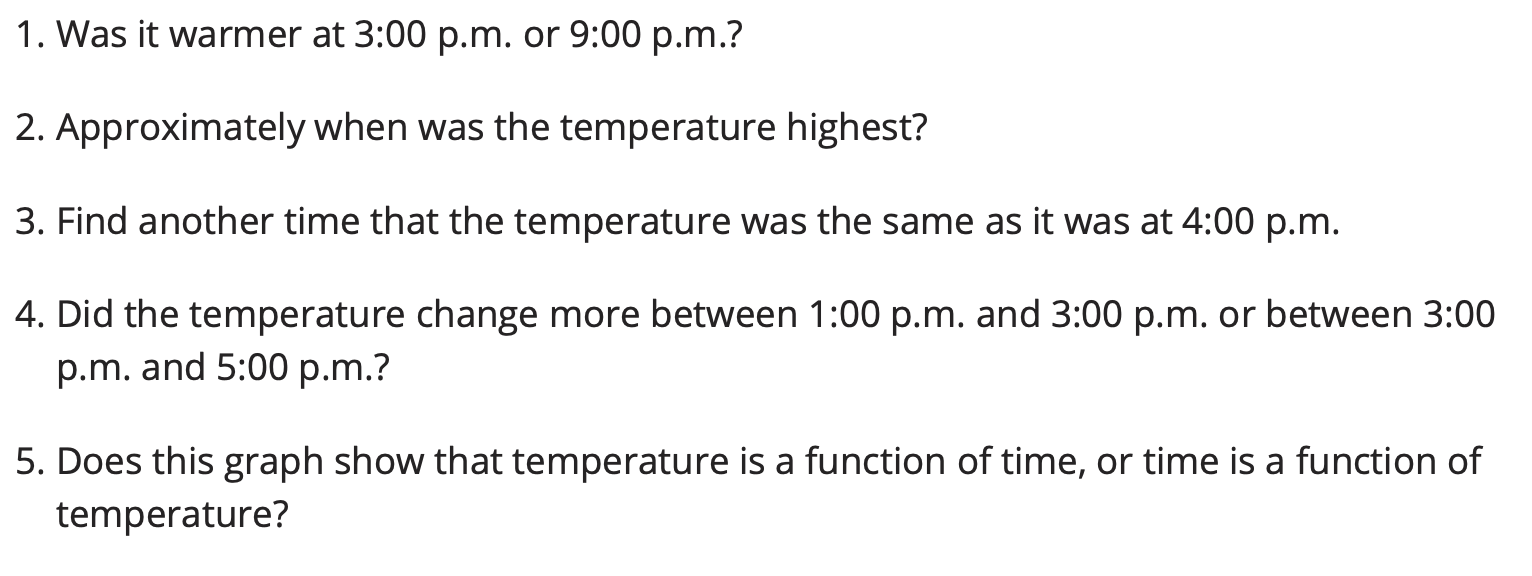
In the original activity, Open Up Resources/Illustrative Mathematics starts with a context about temperature. We’re on board!
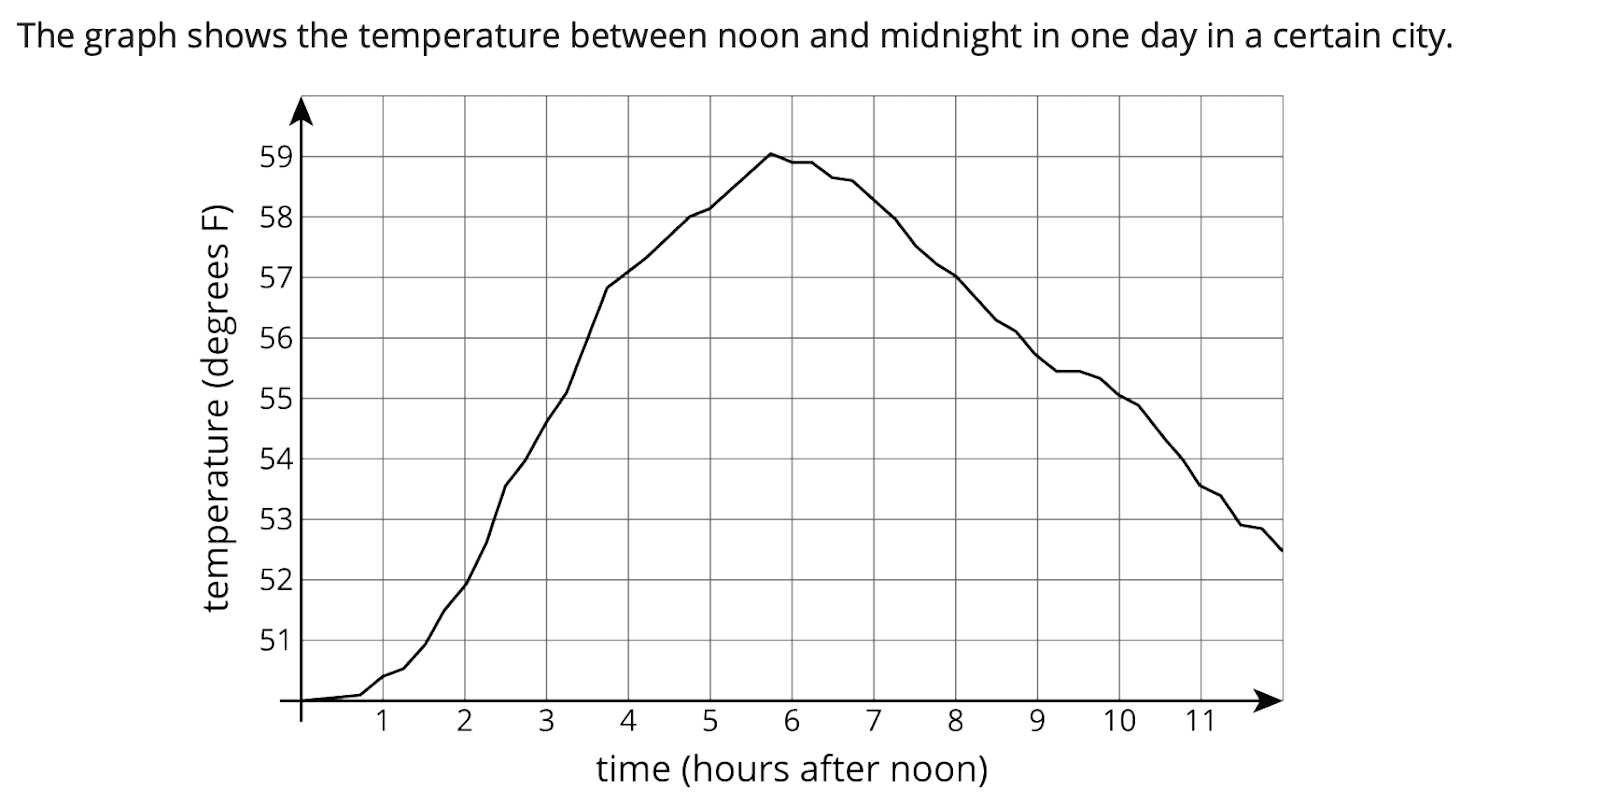
The activity immediately asks students to analyze the graph of a context precisely and numerically, but students have not yet had opportunities to develop and understand the context concretely.
One of our core commitments in designing curriculum is to invite students to use their voice, vision, touch, and intuition in mathematical analysis, all components of what Rochelle Gutierrez describes as “rehumanized mathematics.” If an activity invites students to access and apply their intuition about a context, it strengthens both their later numerical analysis and their sense of themselves as capable mathematicians with valuable ideas.
So in our activity, we chose acontext that has several advantages for students—a race between a tortoise and a hare.
We start by asking students to tell a story about what they see. This is an opportunity for teachers to learn what details are most salient for students. Are they noticing speed? The hare’s nap in the middle. The psychobiological conflict between two species?!
The hare is in the lead and and he stops and sleeps and the turtle wins.
It’s only much later in the activity, after the context has been enriched by the students’ own intuitions, that we ask for any precise, numerical analysis.
Desmosification #2: Give feedback that causes thinking.
Another advantage of this context is that because it’s a digital animation, we can invite students to control its different elements using their own thinking. We invite students to create a race between the tortoise and a dog using a graph. Students create a dog by graphing!
We ask students to create a specific dog—one with a head start that still loses the race, for example. And rather than give students binary feedback—right or wrong—which often fails to credit them for their abundant brilliant thinking even in a wrong answer, we just render the dog they created in the animation. Students can then decide if the dog did what they wanted it to do and make modifications accordingly.
Behind the Scenes
Desmos lesson developer Michael Fenton describes one of the core design dilemmas of the lesson and how our team found our way through it.
We agonized over the details of the race. How fast should each animal move? What distance should we use for the entire race? When and for how long should the hare rest? We wanted something that felt realistic if you look closely at the numbers. We also put a huge emphasis on the end of the race being suspenseful (will the hare catch up?!) while also having a clear-cut winner. And since it was nontrivial to change the parameters of the actual animation, we did most of our iterating with piecewise functions in a Desmos graph, making it easy to see important details from the entire race all at once.
What Did Teachers Think
Loved it! Students are really understanding how the graph tells a story. They know that the flat line means that there is no movement, negative slope means moving back towards the start and the steeper the line the faster the animal was moving. Great results on the cool downs!
My students loved this entire concept with the animals racing. They enjoyed creating the graphs for the tortoise and the dog because they were able to see how their graphs showed the story.
They knew immediately if they were right or wrong and that helped them work backwards to fix their graphs if necessary. My students were also confident in using their prior knowledge about what they know about lines and their steepness.
Students loved being able to tell their own story and give meaning to the graphs, awesome for some students’ creativity to shine through in writing. I appreciated the push for specific, detailed answers. It lent itself to stronger, clearer thinking practices.
What’s Next?
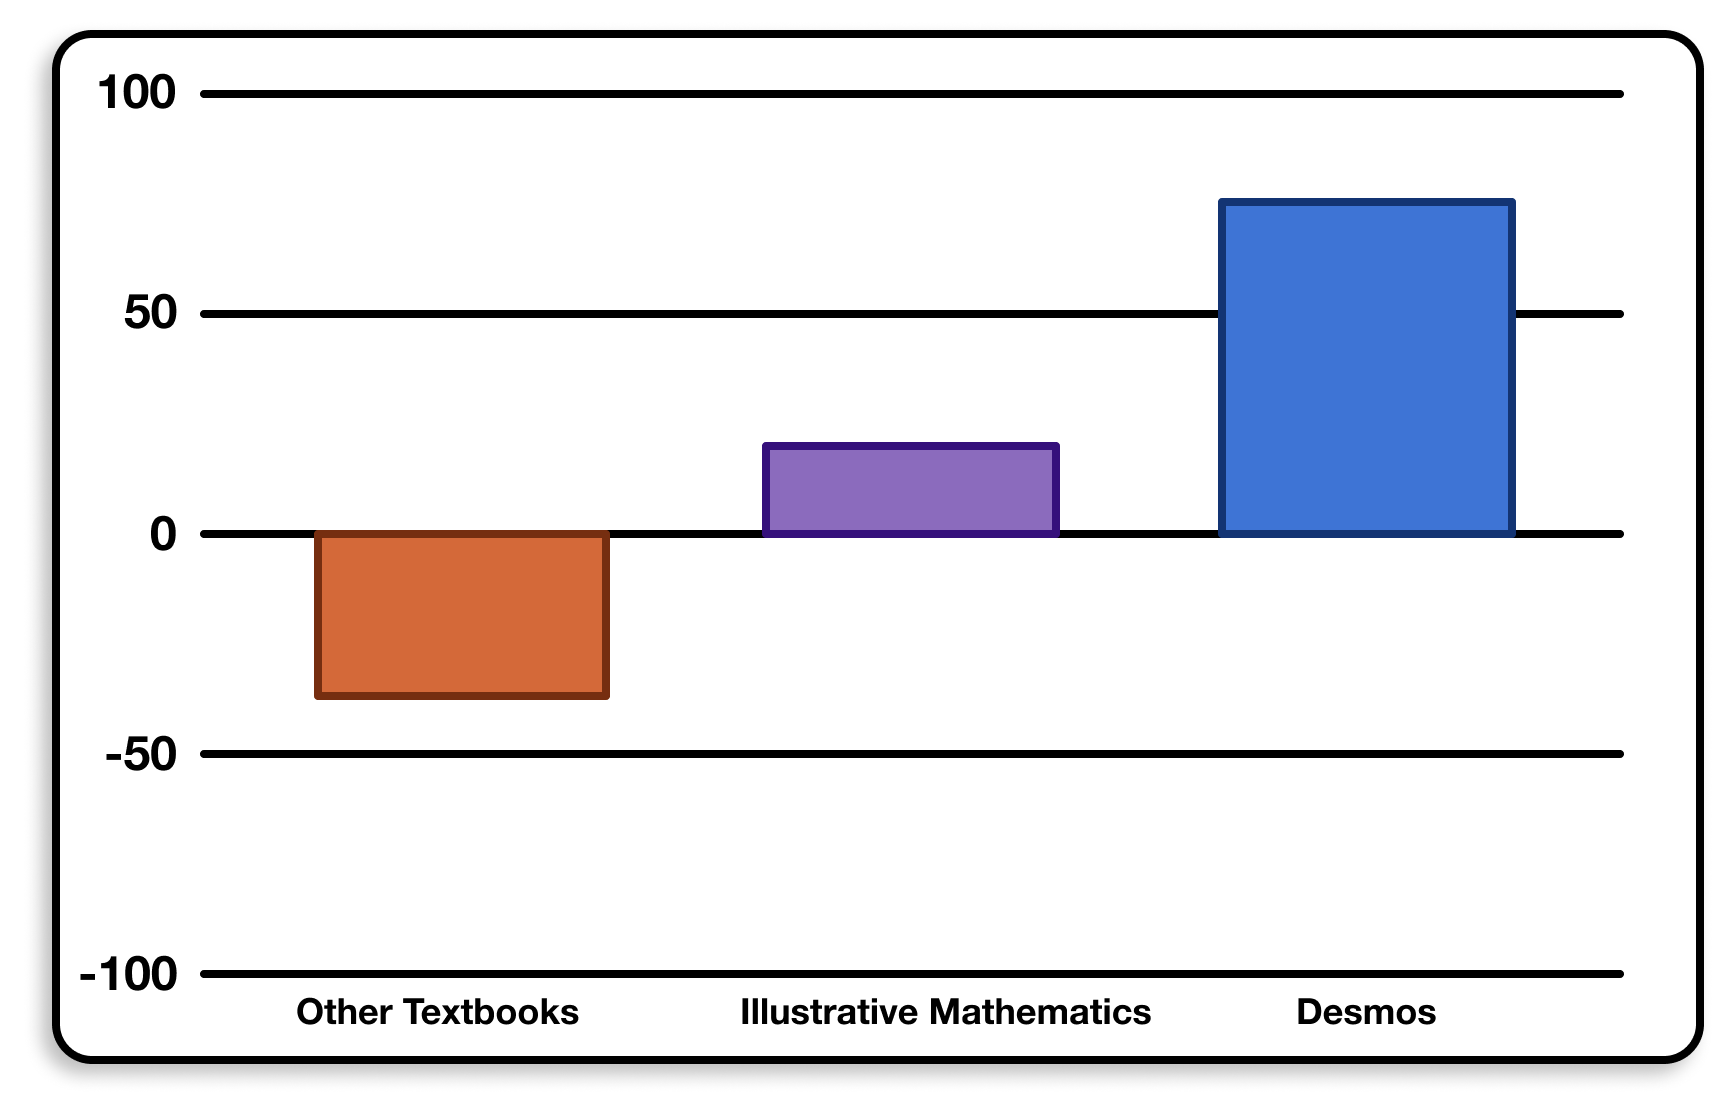
Overall, teachers in our 2019–20 pilot study really liked the Open Up Resources/Illustrative Mathematics curriculum … but they loved what we did to #Desmosify it. (Definition of the scale.)
- Invite your students to learn with one of our curriculum’s activities: Tortoise and the Hare.
- Get activities like this every day in our core middle school math curriculum.