The Friday Fave has been watching the Olympics, which on broadcast television
in the United States means 1000 rounds of figure skating, plus cutaways to
Lindsey Vonn, and to other Americans winning at other things.
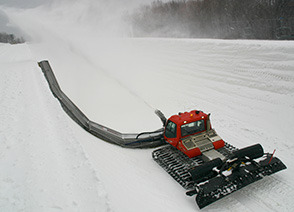
One of those other things that Americans have won at, and so the Fave has been able to watch on network television, is the half-pipe. This led to the Fave and the Fave’s daugther (Lil Fave?) wondering how they make half pipes.
Here’s how:

That thing is called the Pipe Monster, for obvious reasons. Credit and thanks to Zaugg America for the image.
Once you know how the half pipe is made, you’re likely to get curious about related things. Like how do they make the pile of snow for the Pipe Monster to carve? How fast does the Pipe Monster drive down the pipe? How much snow are we talking about here?!?!?
This is the sort of question that Andrew Stadel has been working hard to help people get better at both asking and answering. If you’re not familiar with Estimation 180, get yourself over there right away to find estimation tasks for each of the 180 days of the school year, in sets of increasing difficulty and sophistication.
All of which brings us around to this week’s Friday Fave, which is an Estimation 180/Desmos mashup that Mr. Stadel has been working on. He used Activity Builder to build a richer environment for his estimation tasks, including dynamic visual representations and a robust teacher dashboard for collecting and sharing student responses. He’d like you to use what he built.
It’s really exciting to see teachers putting Des-tools to work in ways we could not have imagined on our own.
But don’t take the Fave’s word for it. Head on over to Estimation 180 and check it out now.
