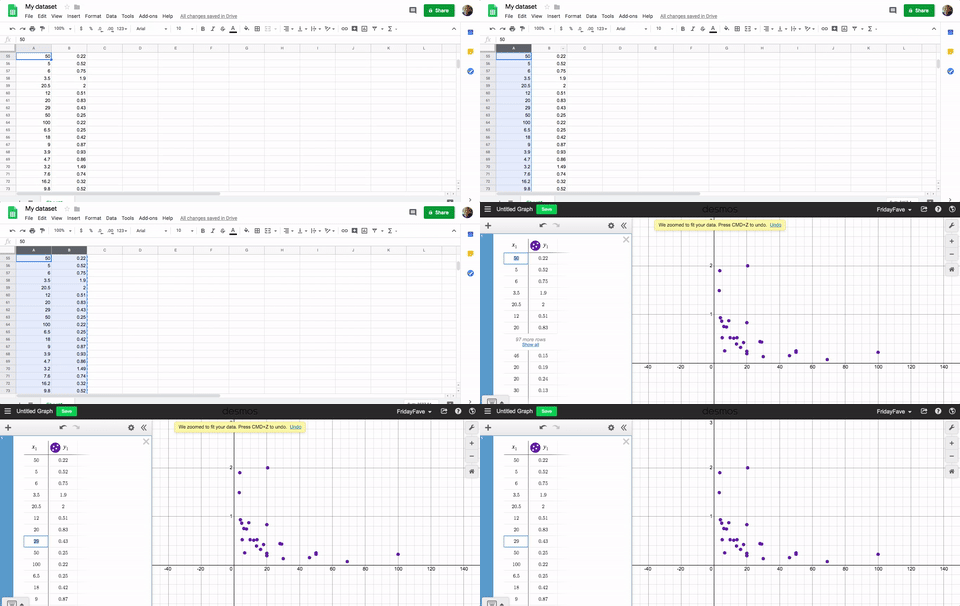
There is so much data in the world. Recently getting that data into the Desmos graphing calculator has gotten a lot easier.
Formerly, if you had a bunch of data that you wanted to get into a table in order to analyze it in the graphing calculator, you had two choices:
- Transcribe the data yourself, or
- Copy and paste a maximum of 50 data pairs from a spreadsheet
Now, thanks to a couple off small tweaks, that 50-pair limit has been lifted*.

When you copy and paste a large data set, we hide some of the rows in order to keep the expression list manageable. At the click of a link, we’ll toggle whether those extra rows are hidden.
And if you don’t want data pairs because you have a large univariate dataset? No problem! When you paste it, we’ll make it a list.
Virtually unlimited copying and pasting of data sets is this week’s Friday Fave!
*For the record, the new limit is 1000 rows.
