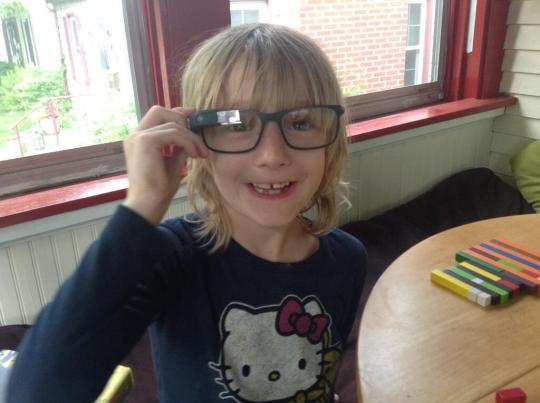
Until every student is walking around looking like this…

…the graph-colored glasses we want our students to develop will have to remain metaphorical.
Let the Friday Fave and the opticians at Dr. Desmos help you adjust your students’ prescriptions with Graphing Stories.
Students watch a short video. What do they notice? What variables can they measure? They see what their classmates think. Then we focus their attention: Graph the relationship between X and time.
There is a Function-Carnival feel to the work here, except that the videos are live-action, and feedback comes from seeing answer graphs.
A students work, they can help each other notice rates of change, upper and lower bounds on values, discontinuities and so forth. This helps everyone in class to sharpen the way they see the world with math.
So click on through; the eye doctor is in.
