This week’s fave is a new feature and a salute to things that work the
way you sort of expect and hope that they would.
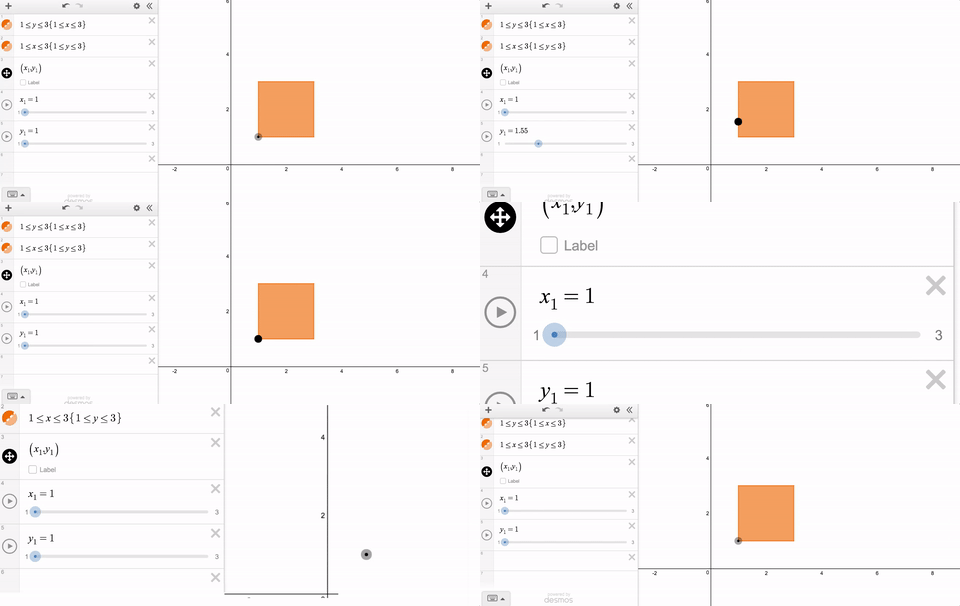
Let’s say you want a movable point that stays within the bounds of a rectangle. That’s no problem. Use slider limits that match the minimum and maximum values with the rectangle.

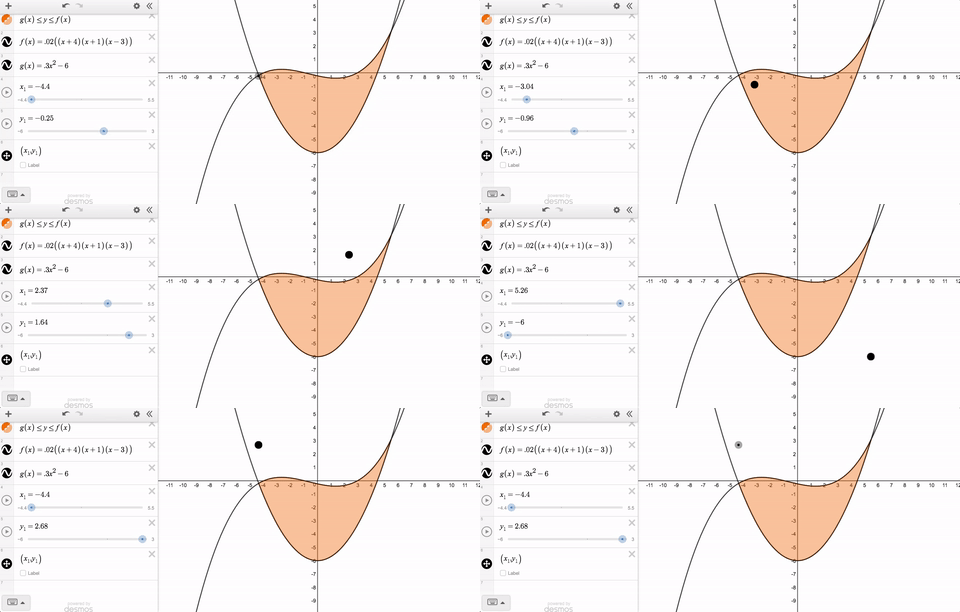
But let’s say you want that point to stay within some non-rectangular region. Until quite recently, that was a problem because the limits on your slider had to be constants. Staying within limits that change was not possible.

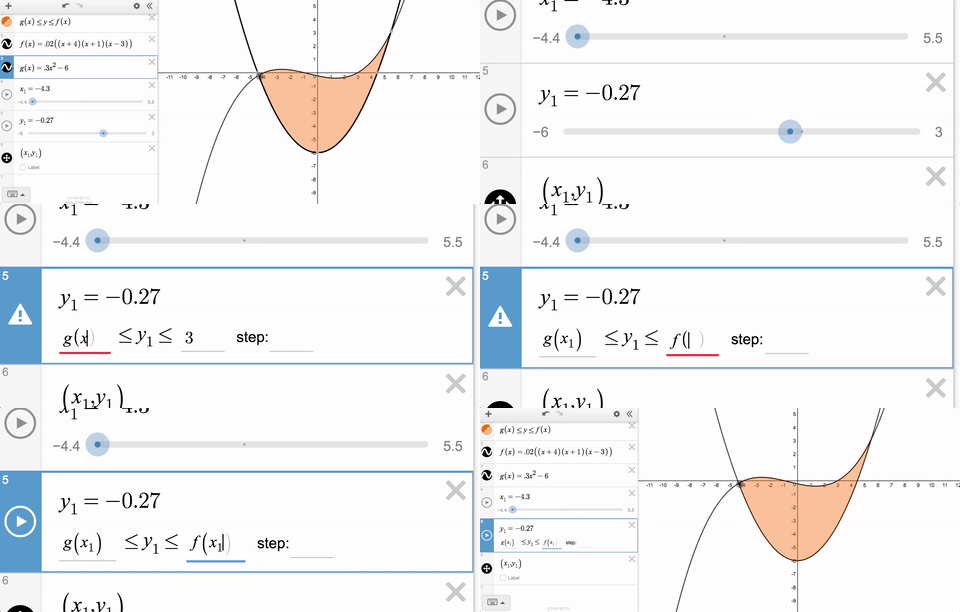
If you’ve ever tried to solve this problem, you’ve probably typed something like this into your slider limits.

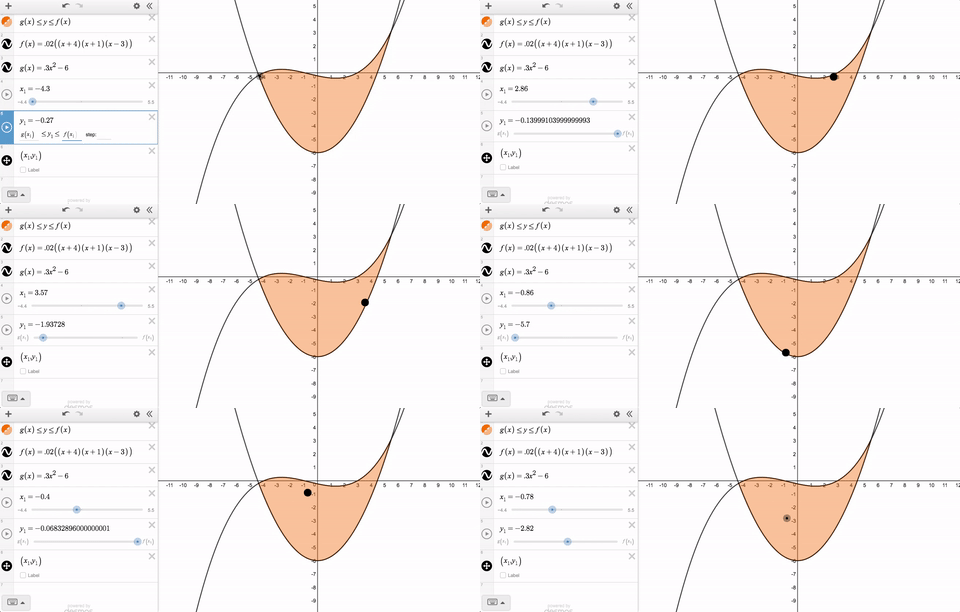
Until recently, we threw an error and told you that you couldn’t use variable slider limits. But now you can, and here’s what it looks like.

Variable slider limits, and syntax that feels natural—together those are this week’s Friday Fave.
And here are a few more graphs that use variable slider limits. Maybe they’ll spark some new ideas!
