Graphing Inequalities
Adding colored shading to your Desmos graphs is easy with inequalities. Use < and > for strict inequalities (dotted line), and <= or >= for non-strict inequalities (solid line). Check out the video below for a quick demo.
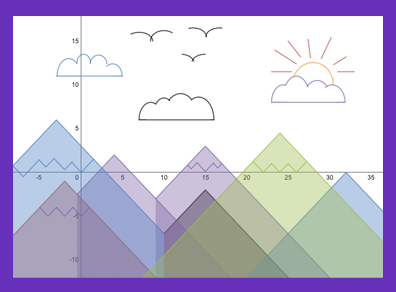
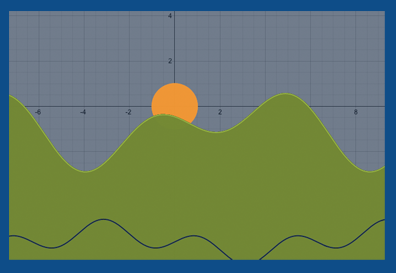
Now that you know the basics, kick your shading skills up a notch! Here are some creative uses of inequalities for some graphing inspiration. What can you create?
Mountain Sunset - by Adrienne

https://www.desmos.com/calculator/qnaua1blyq
Lovely Evening

https://www.desmos.com/calculator/cpolo6rx1g
Find even more examples of inequalities on our Pinterest page. Let us know what you think! Tweet us @Desmos or shoot an email to calculator@desmos.com.

