
Have you ever wondered how to find points of interest on Desmos? It’s easy! Watch the brief video tutorial beneath this post for a quick rundown of how to find maxes, mins, intercepts, and intersections between several expressions.
Now head to the calculator and give it a try. You can start with this graph of wave interference:
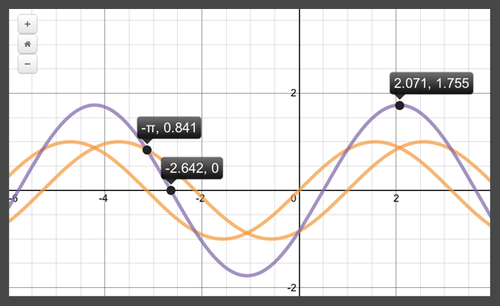
Click on your curve or the equation to display its Points of Interest. Drag the “a” slider to watch the phase difference increase and decrease between the two curves. As you do this, what happens to your POIs? Pretty cool, right?!
Click here to explore Points of Interest on some of our other favorite graphs. Let us know what you think! Tweet us @Desmos, post to our Facebook wall, or shoot us an email at calculator@desmos.com.