
Every day, our users fill
our homepage with
incredible graphs. Today, we’d like to highlight a few creations that
have truly inspired us.
First up is Andrea, a high school student
from a bilingual school in Guadalajara, Mexico. Her graph is a hoot!
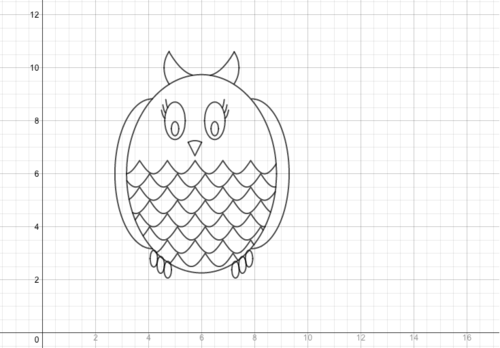
See Andrea’s equations here: www.desmos.com/calculator/90f6jzjqiu
Mr. Seaberg, her math teacher, uses Desmos to help his students
understand function transformations, function applications, domain/range, and
a host of other concepts with our calculator. When asked about his experience
using Desmos with his bilingual students, he said:
Many high school mathematics courses in Mexico are taught in a very
traditional, everything-by-hand kind of way, and it has been wonderful and
very refreshing to bring more technology into my classroom. It’s also
exciting to see that the calculator is constantly being improved and
updated!
Next is Jasmine, a high school junior in California. She hit a
homerun on her math project! When we asked her about the process, she
highlighted one of our most important values:
From making this graph, I learned how fun it is to actually do math. I
enjoyed finding the limits and putting the equations together to make this
picture. I chose Desmos because it looked like a very good website to graph
and it very easy to use.
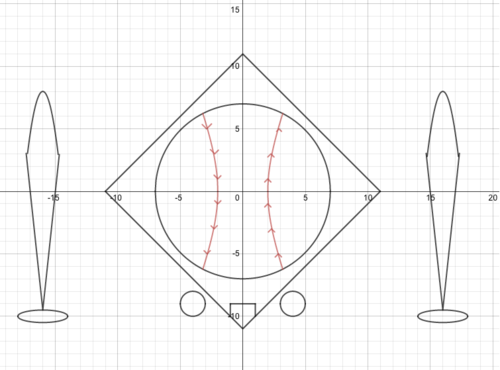
Thanks Jasmine!
See her equations here:
www.desmos.com/calculator/dbxpnzfn47
Another of our recent favorites is from user K. Reka, who made this
beautiful spiral graph.
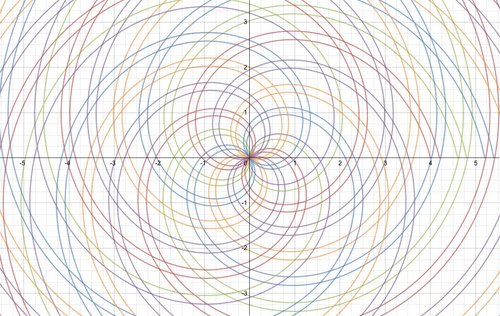
See the equations here: www.desmos.com/calculator/llr1xhuiki
Lastly, Yvette from Jalisco, Mexico created a lovely ballerina graph and
became a hit on
Facebook!
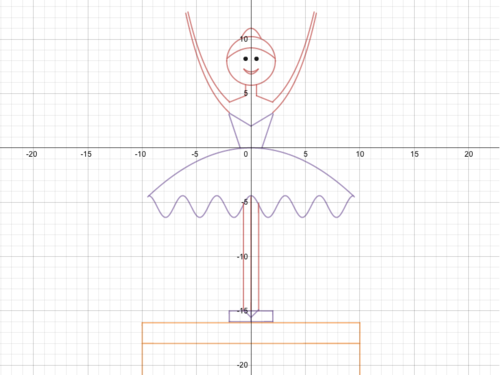
See Yvette’s equations here: www.desmos.com/calculator/shhoaghu8n
Want us to showcase your #desmazing graph? Share it with us via
Facebook,
Twitter, or
Pinterest!