
When we unveiled our free graphing calculator a month ago, my mother said it was perfect! The other 10-something-thousand of you had slightly more constructive feedback. We love the kind words (“wow, I just found this link and am hooked;” “Incredible Work!!!!!!!!!!!!!!!!!!!!! Congratulations;” “I love this calculator so much! I’m obsessed with drawing graphs with it now…;” “If I were there right now, I’d kiss you guys”) and the ratings (perfect score in the chrome app store), but even more, we love to hear your ideas. And we’ve acted on them. Here’s a peek at the new goodies now available, free as always, at http://desmos.com/calculator/
Trace
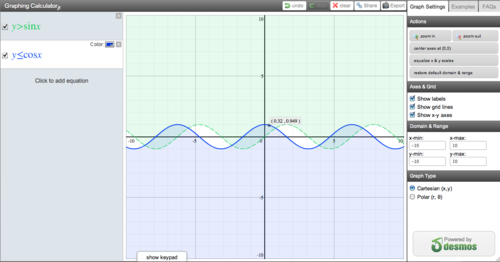
Select any cartesian equation and then mouse over to trace the graph. Your cursor will snap to points of interest: zeroes, extrema, even intersections with other lines. See below for a video on trace features.
Strict Inequalities
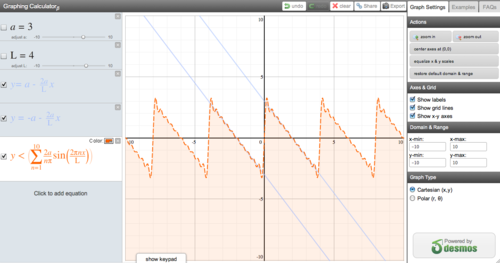
Dotted line inequalities are a little tricky to do on paper. On a computer? Ouch. But we had more requests for this than almost any other feature, and we did it. Type “y < x” and you’ll get a dotted line. “y <= x” and you get a solid line. It’s just one more reason that our calculator does a more accurate job of demonstrating these core math concepts than anything out there.
Polar Inequalities
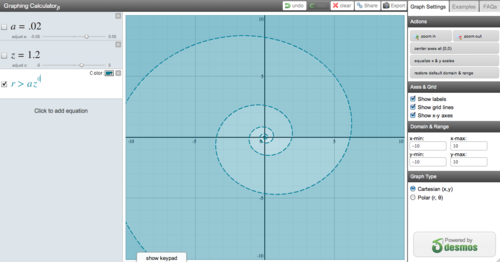
As if inequalities weren’t enough, we decided to go all out and build polar inequalities. Getting this both precise and meaningful was a tricky enough problem that I’m eventually going to devote an entire blog post to it. I’d love your thoughts on how we did.
Internationalization
It turns out that some foreign keyboards were tripping up our calculator. In fact, the only complaints we received were from people having trouble inputting on non-US keyboards. So, naturally, we dug in deep and fixed it. The calculator should work on any international keyboard you try to throw at it (figuratively).
Slider bars
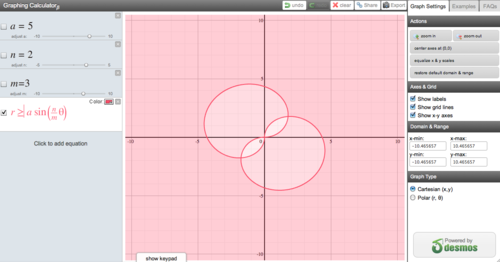
This one has long been a dream of ours. We’re all about tactile, instantaneous feedback, and this is a huge step in that direction. Write something like “a = 3” and notice a magical slider appear underneath. You can then reference that from another equation (“y = ax”) for example, and see how changing “a” affects the graph. Pretty cool. See below for a video of the slider bars in action.
… and much more
Keep the feedback flowing! E-mail us at calculator@desmos.com with your suggestions, complaints, recipes, diatribes, and compliments. We love our calculator, and want you to feel the same.
- Eli