Two weeks ago the Desmos Fellows had a Desmos Potluck. This week we’re continuing to learn from and enjoy the graphs that were contributed. Check out the latest round of Desmos Potluck graphs to level up your calculator skills, and expand your knowledge of what is possible with the Desmos Calculator.
In this week’s offerings you’ll find a variety of graphs that range from artistic designs created using lists, to graphs that make use of parameters to control an animation.
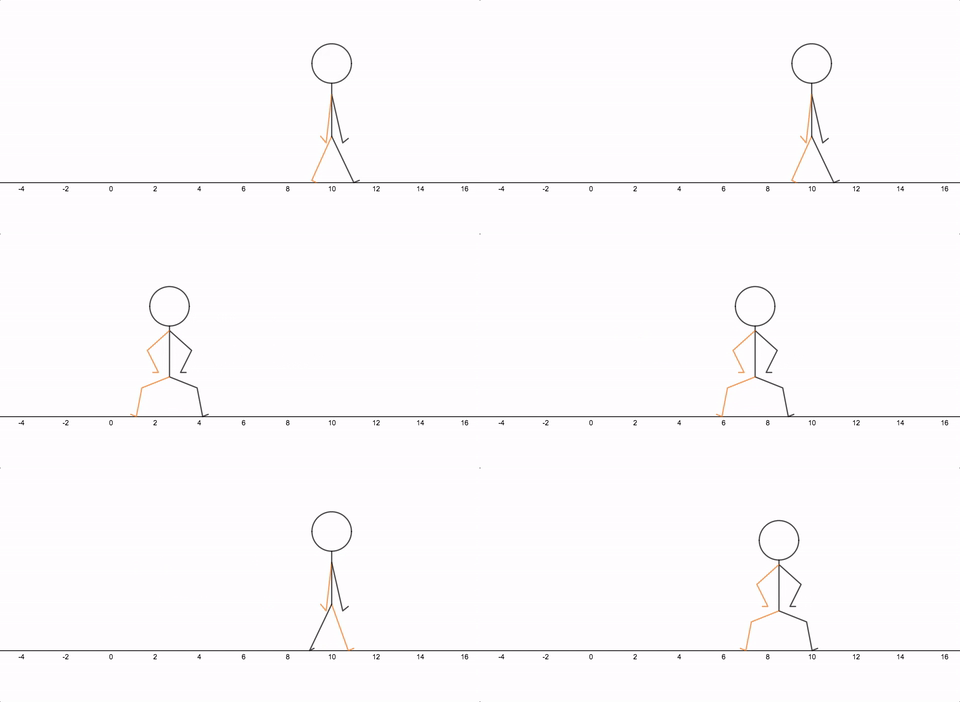
Jenn Vadnais created this animation using tables and a single parameter to control the motion.

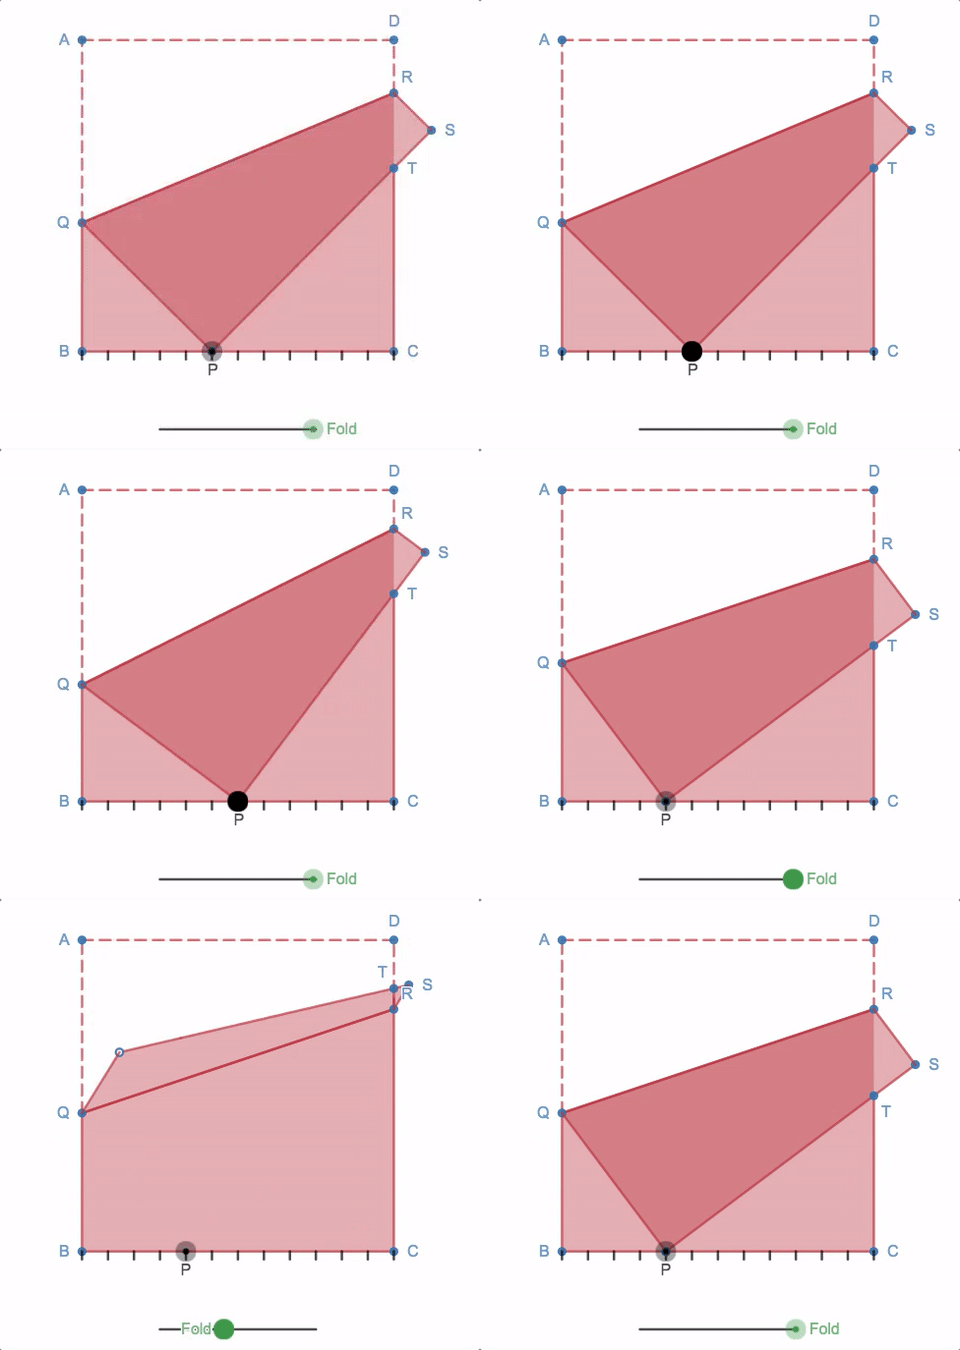
Paul Jorgens created this graph as an extension of the Origami Challenge that he uses in his Algebra class.

As with all Desmos Potlucks, we hope you’ll join in the fun! Here’s how you
can participate:
- Find a graph from the activity that interests you. Try to recreate that graph. If you need support, you can ask us on Twitter @desmos or take a look at the contents of the folder. Some folders are hidden from the student view, so feel free to make a copy of the activity and check the folder contents in authoring mode.
- Let us know on Twitter which graph you recreated. What did you learn as you created the graph? Any surprises or challenges?
- What dishes can you contribute?
