
Brrrr! Piping cold out of Desmos Labs: Polar Axes! Although graphing polar functions has been possible since Desmos went live, you can now switch from Cartesian to Polar graph paper to better visualize your polar equations.
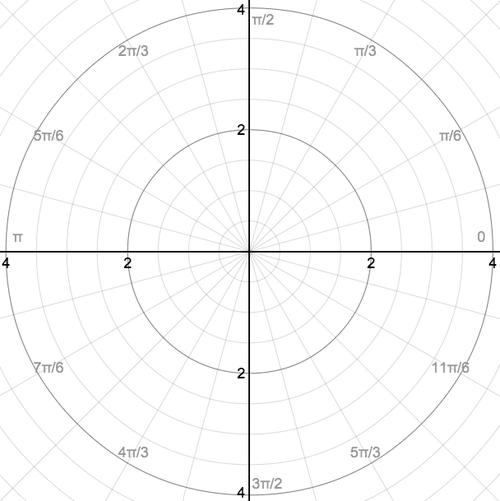
As opposed to the standard x / y coordinates, polar graphs are constructed in terms of the radial distance from the origin ®, and the angle from the x-axis (θ). The r value is measured by the concentric circles you see above, while the θ value is indicated by the lines radiating out of the origin.
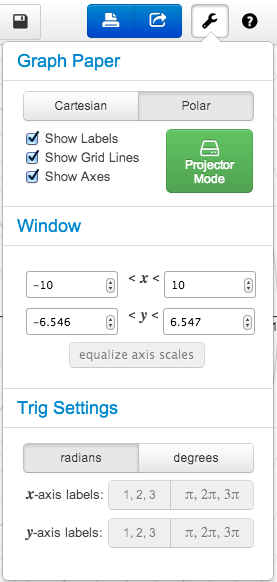
Activate Polar Axes by clicking Options (the wrench icon at the top right of the calculator), and then toggling Polar. Then, just start entering expressions in r / θ (type “theta”) notation to create beautiful polar graphs. Click on Options again and look under Trig Settings to switch between Radians and Degrees for maximum flexibility:
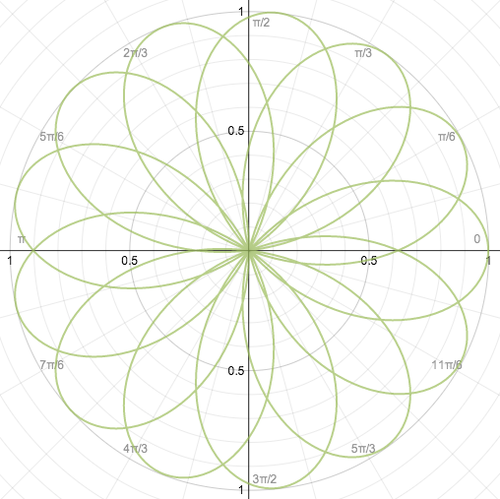
Below are a few examples of graphs displayed on the new axes:
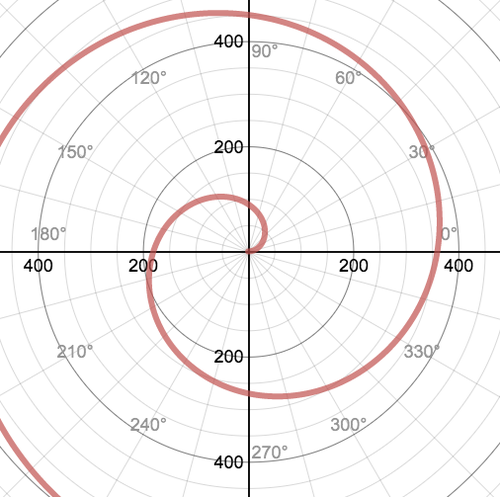
r=θ (in projector mode / degree mode)
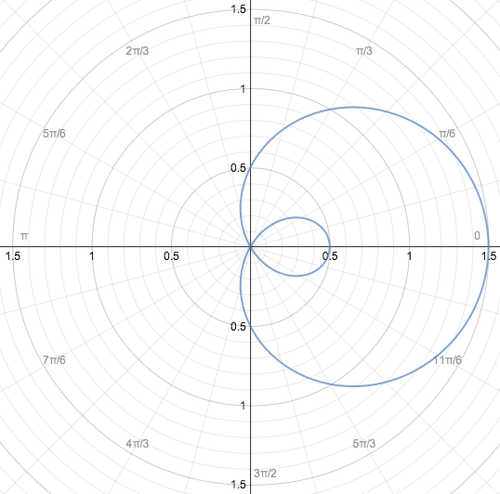
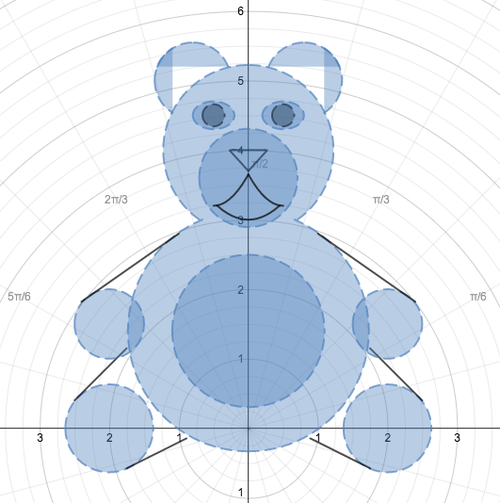
A “Polar” Bear! (original by Desmos user Sydney from Tennessee)