
Limiting the domain and range on the Desmos graphing calculator is simple. Once you’ve mastered this feature you’ll be cranking out incredible graph art in no time. Watch this quick tutorial to learn how:

Who knew piecewise notation could be so fun! Click the graphs below to see domain and range restrictions in action:
Bridge, graphed by Brian: www.desmos.com/calculator/zpceslgvw2

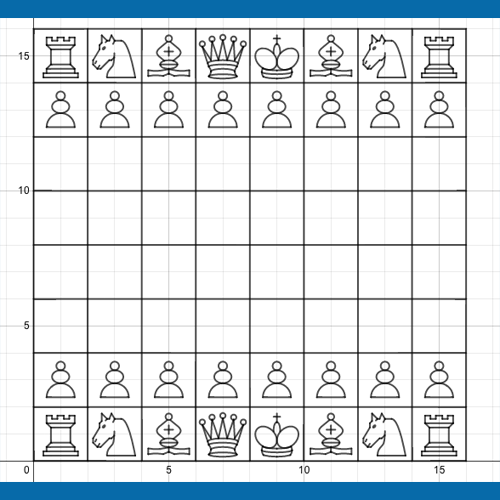
Chess Board, graphed by Eric: www.desmos.com/calculator/1xx7armsfg
What can you create with Piecewise? Tweet us your graphs @Desmos or post them to our Facebook page.