Here’s a question we get asked a lot at Desmos:
Hey Desmos! Love your calculator! When will it do stats?
Finally, the answer is now.
A wide range of statistical functions is now live in the calculator
Let’s say you’re analyzing eruption data from Old Faithful so you have a list of the lengths—in minutes—of a large number of geyser eruptions. If that list is called G for geyser, then just type histogram(G) or boxplot(G) or dotplot(G) and you’ve got your data visualization, and you’re ready to analyze.

But wait there’s more!
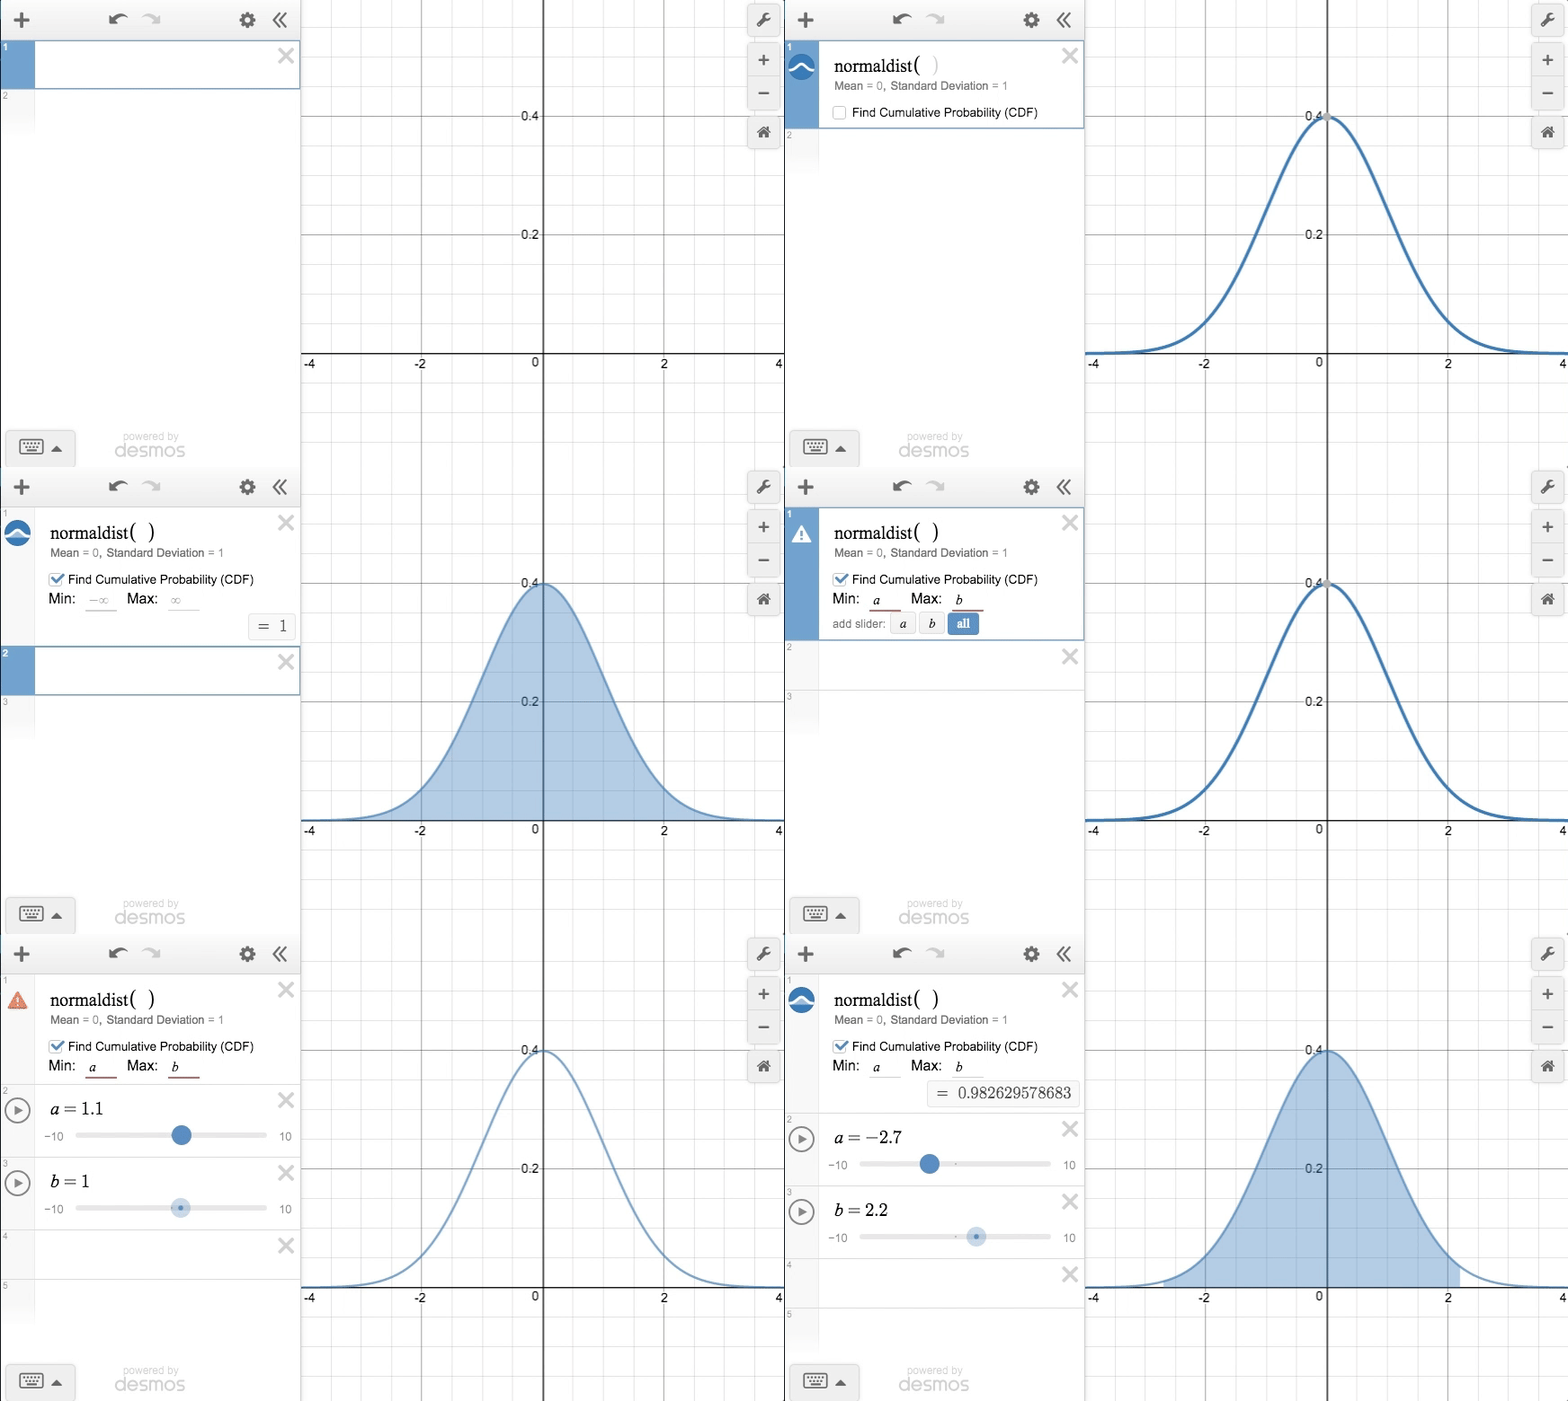
Do you need to work with the cumulative density function for the normal distribution? That’s built right in.

Our internal goal was to make the calculator’s statistics capabilities be sufficiently robust that AP statistics teachers wouldn’t need to use other tools. We’re here today to say that we think we’ve met that goal. As always, let us know if and how we’ve fallen short.
More details are on our support site, and Desmos Fellow Bob Lochel put together a short video to walk you through some useful new features.
Enjoy, and keep letting us know what tools you need to do great math (and now statistics)!
