This week Desmos fellow
Anna Scholl asked us where
our inspiration comes from when building Desmos graphs and activities. The
Desmos fellows shared their sources of inspiration as well as activities and
graphs to help inspire others.
Like many others, Jenn Vadnais shared that “My inspiration often stems from need. Necessity is the mother of invention.”
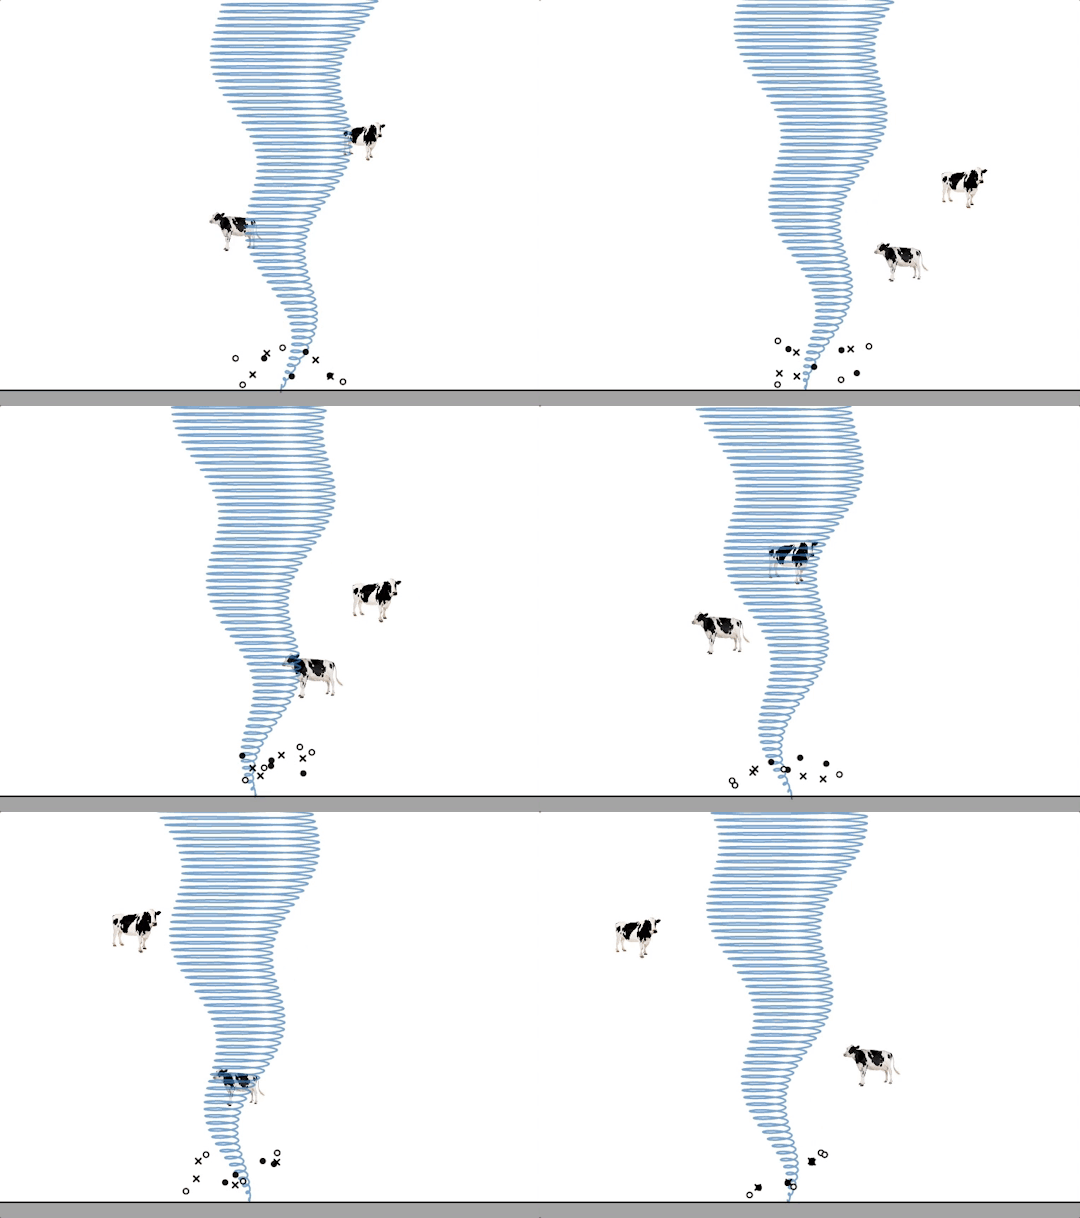
While most of our group was inspired to create based on a need to help students learn, several of us were inspired by our own need to learn and grow, the need to figure out how things work, and interest in general. Several of the Desmos Fellows pointed to our Potluck activities as a source of inspiration as well as activities and graphs posted on Twitter and in our internal chat channel. Suzanne von Oy shared that she generally makes graphs just for fun, finding inspiration from websites, tweets, and even requests from coworkers and students such as the graph below.

Bob Lochel shares that “What inspires me most when creating activities is thinking deeply about the path a student will take during an activity - I want there to be a clear thread weaving through, but I don’t want students to encounter any brick walls.” Our group was similarly inspired by this need for connecting ideas and supporting students in their thinking. Read our list below of student needs that inspire our activity creation.
-
The need to visualize.
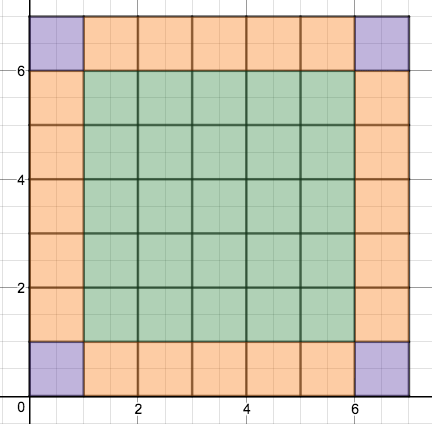
Patty Stephens built
this graph to
help her students visualize a 3-Act task called
Frosted Cube Cake.

-
The need to play and explore.
Jade White finds that her
students are more active in discussions with their partner when they are
working through an activity. Including activity screens where students can
explore a math concept can increase discussion and student questioning as
well.
-
The need to discuss and make sense of mathematics.
Allison Krasnow has been
choosing problems from her curriculum’s exit tickets and using those
to build
quick error analysis activities. After discussing both correct and incorrect ways of thinking, students
are invited to improve their initial responses.

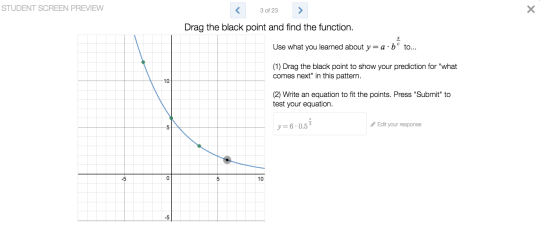
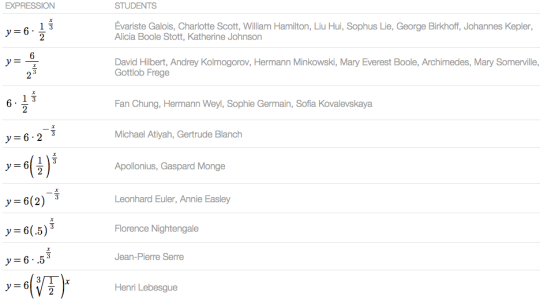
- The need to reflect. Paul Jorgens asked his students to spend time noticing how this set of class generated equations for the screen above were the same and different. “We wondered if they drew the same graph. Groups used their understanding of reciprocals, division and negative exponents in the process of arguing whether they were the same (or not).”

-
The need for feedback.
Nerissa Gerodias appreciates
activities that help students see their misunderstanding immediately. She
hopes that over time this feedback leads to both increased understanding as
well as curiosity that will inspire students to explore on their own and see
the beauty in mathematics.
What inspires you in your Desmos creations? Let us know on Twitter @desmos.
