Explore this graph

Des-blog

Recent Posts

Friday Fave for September 21

Hashtags are funny things.

Mocked, memed, misunderstood, and yet so solidly useful.

This week’s Friday Fave is a particularly useful hashtag: #ImproveMyAB (where AB stands for Activity Builder, of course).

The brainchild of Desmos Fellow Kathy Henderson, #ImproveMyAB is a key to unlocking some most excellent collaboration online. By posting an activity to Twitter using #ImproveMyAB, you are saying two things: (1) “I have been working on an activity (or and idea for one)” and (2) “I have an inner desire to make this activity into something great!” You are issuing an invitation to conversation about teaching.

Of course, the hashtag is also a great place to stop by to see what others are making and to offer your own advice.

A quick peek at the hashtag turns up recent conversations about activities on a wide range of topics, including derivatives, exponential functions, domain and range, and exterior angles of polygons. Do you have thoughts to offer on these topics? Do you need inspiration for them? Do you have something else you’d like to work on, and need to connect with folks who can help? Check out #ImproveMyAB, it’s hashtag-amazing!

And it’s this week’s Friday Fave.

Friday Fave for September 14

The fave is fond of triangles, and after playing with this week’s activity your students probably will be too.

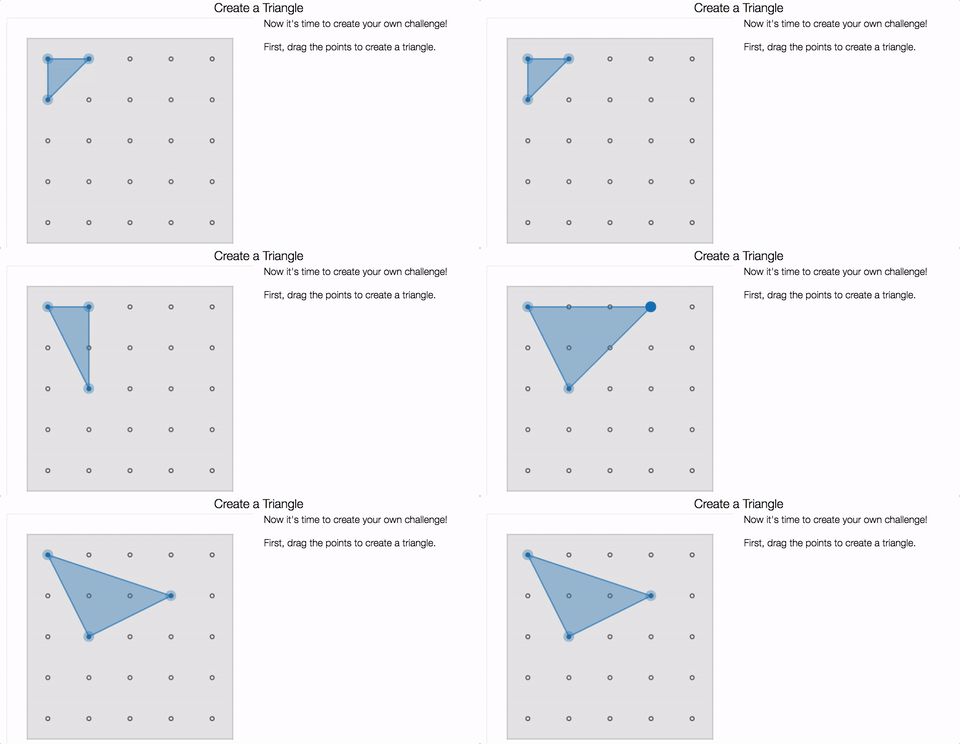
This week’s fave—Exploring Triangle Area with Geoboards—is newly released and consists of a few warm up screens and a Challenge Creator. This Challenge Creator is a doozy.

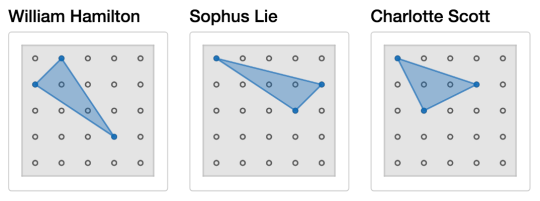
How many triangles are possible on a 5-peg by 5-peg geoboard? And how many different values for the area are possible? Who knows? But whatever the number, it’s great enough to allow for a lot of creative triangle building.

Maybe you build a tricky triangle and think to yourself, “No one will be able to reproduce this one!”

But it turns reproducing your triangle isn’t the challenge; building a triangle with the same area as yours is. Indeed, odds are that your classmates will solve that challenge with a variety of triangles.

Along the way, you’ll wonder about the greatest possible area (are you sure it’s 8 square units? How do you know?), the smallest possible area (Are you sure it’s half of a square unit?), and what areas are possible in between?

The focus on student-created challenges with plenty of opportunity for creativity—that makes Exploring Triangle Area with Geoboards this week’s Friday Fave.

Friday Fave for September 7

This week’s fave is a new feature and a salute to things that work the way you sort of expect and hope that they would.

Let’s say you want a movable point that stays within the bounds of a rectangle. That’s no problem. Use slider limits that match the minimum and maximum values with the rectangle.

But let’s say you want that point to stay within some non-rectangular region. Until quite recently, that was a problem because the limits on your slider had to be constants. Staying within limits that change was not possible.

If you’ve ever tried to solve this problem, you’ve probably typed something like this into your slider limits.

Until recently, we threw an error and told you that you couldn’t use variable slider limits. But now you can, and here’s what it looks like.

Variable slider limits, and syntax that feels natural—together those are this week’s Friday Fave.

And here are a few more graphs that use variable slider limits. Maybe they’ll spark some new ideas!

Fraction Bars

Fraction Shading

Strange Rectangle Tool