Activity Planning Tips
We asked the Desmos fellows to share pitfalls to be avoided when facilitating
a Desmos activity. They shared challenges they’ve faced in the past as well as
areas of growth. Read their tips below.
Identify your learning targets.
Glenn Waddell and Dave Sabol both had experiences in the past where student work or activity review could have benefitted from more intentional planning. Glenn shared that “I think the biggest pitfall I have had was a lack of intentionality. I would make slides thinking, ‘Oh, this slide will teach x, y, and z concepts’ and then discover that it was so confusing to learners that they struggled and questioned the presentation instead of being able to deeply dive into an concept or idea. Having the story clear and mapped out, having a clear intention for each slide, each question, each element of the AB is essential so the learners are questioning what I want them to question, instead of the way it is delivered.” In the past, Dave would explore each screen with the class during a review. More recently he’s found it helpful to consider the greater purpose of each screen and what type of feedback might be appropriate. Planning with learning targets in mind can help here as well.
Plan your teacher moves.
Lisa Bejarano shares that the biggest mistake she’s made in the past is assigning an activity to students with no facilitation plan or time for discussion or reflection. Stephanie Blair has also faced this challenge, and has been taking advantage of Desmos teacher guides since their release: “Since the creation of the teacher guides, I have became a lot more purposeful in planning when to use the conversation tools. I also have a place to write down anticipated discussion prompts and what I hope to highlight in front of the class. This has been incredibly helpful.” Lisa uses the teacher guides to plan by working through the activity herself first, anticipating student responses, and planning teacher moves. She’s also found it helpful to be flexible and ready to adjust plans based on student responses.
Leave time for closure.
Several of the Desmos fellows have created activities that were too long or
contained too much content. This is challenging for a number of reasons,
including the lack of time for closure.
Linda Saeta reminds us of the
importance of closure: “I feel that I can create some excitement in class, but
like a soda that is bubbling, I don’t leave time to close the lid on tightly,
so most of those bubbles are gone by the next day.” It can be helpful when
planning to consider which parts of the activity can be skipped or saved for
the next day to ensure that there is sufficient time to wrap up the learning
for the day.
These are just three of many considerations that can be helpful in planning to use a Desmos activity. Consider downloading a teacher guide for your next Desmos activity and use the Activity Checklist to help with planning.
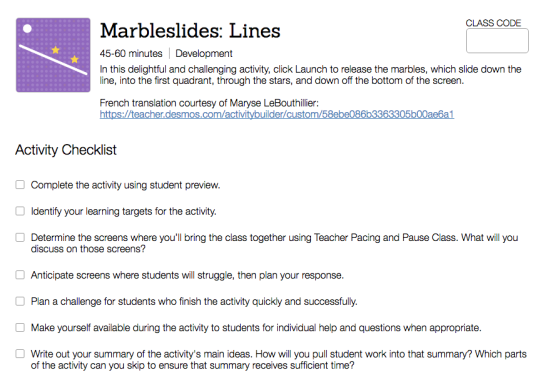
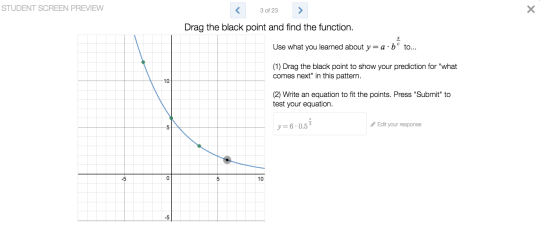
Sample Activity Checklist from a Teacher Guide

