Explore this graph

Des-blog

Recent Posts

Fellows’ Lounge: Conference Proposals

The Desmos fellows have been brainstorming possible sessions for upcoming state and national conferences. This past week we considered the following questions to help us get ready to write our proposals:

What is your big idea for the session? If that idea is aspirin, then what is the teacher’s headache? Under what circumstances, would your big idea offer teachers a feeling of relief from pain or a feeling of power over a problem they experience frequently?

Here are some of our ideas:

  • Jade White is working on a proposal for a session focused on activity building. Participants in this session might ask, “How do I design an activity to meet the goal of my lesson? Which Activity Builder tools do I use (sketch, draw, answer, etc) and when? How do I conclude the lesson?” To help with these challenges Jade hopes to focus on a design process to help teachers develop their ideas and move from the big lesson idea to the individual screens of the activity.
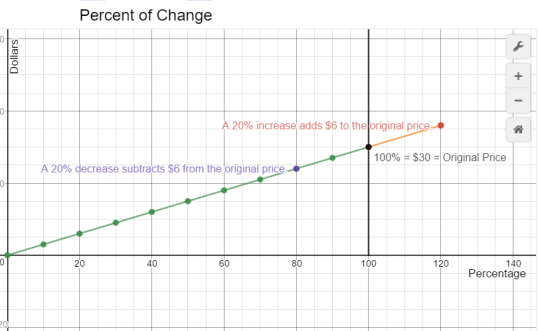
  • Jenn Vadnais is proposing a session on using Desmos to develop double number lines and visuals for representing the proportionality of percents. This session’s aim is to build coherence around related topics that are taught in grades 6-7, and to support conceptual understanding of percents.
image

Students can use color and labels to demonstrate understanding of percents.

  • Paul Jorgen’s session idea is around the headache many of us encounter when a group of students are all in varying spots in a task. He states, “We will see mistakes in their work. We might wonder if they arrived by many trials and if those repeated trials have led to learning. What moves do we make? Where are the opportunities the formative assessment? What role do we take facilitating the task?” The aspirin for this session is around pedagogy of digital activities and helpful teacher moves.
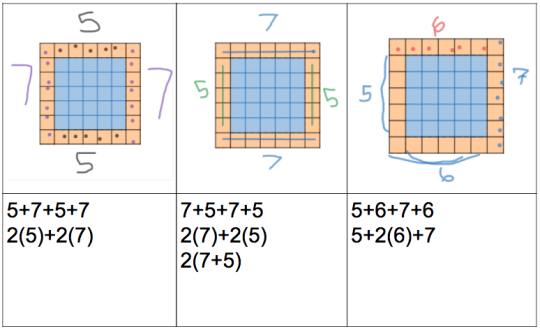
  • In her role as an instructional coach, Allison Krasnow noticed that teachers can feel torn between spending time at their computer looking at student work and circulating the classroom to help struggling students, including English Language Learners. Allison has been using Desmos activities along with word banks, sentence frames and screen shots of student work as warm ups to support all students developing academic language and deepening their ability to communicate mathematically.
image

Student work from the Pool Border Problem.

  • Dave Sabol is leading a couple of multi-day Activity Builder sessions this summer with a focus on how to use Desmos activities to improve student engagement. He sees the headache as a lack of student engagement, with the aspiring being the ability to leverage the dashboard with an understanding of the Activity Building Code to meet students where they are and bring them into the class discussion and lesson.
image

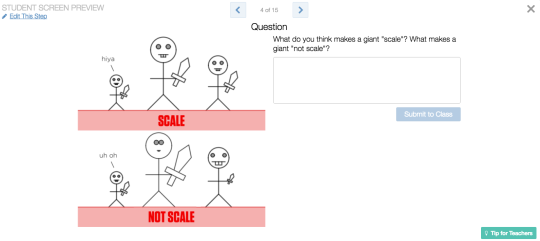
One way to engage students is to start with informal ways of thinking.

  • Anna Scholl’s session idea is on demonstrating activities that create conversation naturally and how to use the teacher pacing tools to facilitate classroom conversation.
  • Linda Saeta’s session idea is about how to develop in students a habit of using math to become informed voters.

Look for these and other Desmos sessions at a conference near you!

Friday Fave for March 24

Sometimes the Friday Fave just wants to have fun.

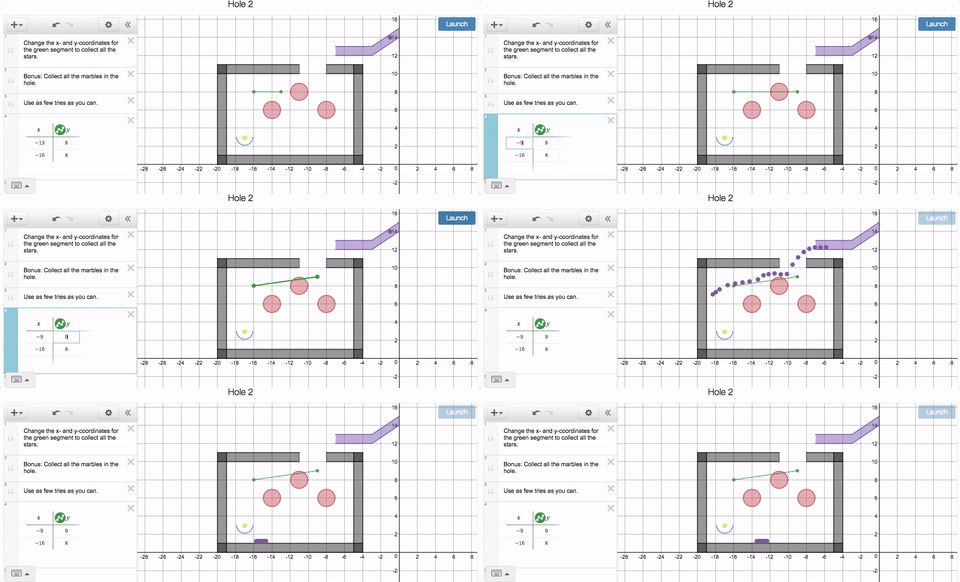
There are few things more diverting than a good round of minigolf. Desmos Fellow Jenn Vadnais put together a Marbleslides/minigolf mashup, Desmos applied a small amount of Activity Polish ™, and now it is offered up to you as this week’s Friday Fave: Minigolf Marbleslides

You cannot control your club, but you do control deflections of the marbles as you strive to get them in the hole. Don’t bother lining up your shot; this game is all about the carom.

So next time you need your students to get some practice with specifying and naming points in the coordinate plane, give Minigolf Marbleslides a try. It’s this week’s Friday Fave.

And since you’re already thinking about small versions of big things (for that’s the whole thing about minigolf—it’s right there in the name!), why not check out a few more Desmos activities related to scale? Here are three to try:

Marcellus the Giant

Polygraph: Transformations

Blue Point Rule

Patterns and Animations

Two weeks ago the Desmos Fellows had a Desmos Potluck. This week we’re continuing to learn from and enjoy the graphs that were contributed. Check out the latest round of Desmos Potluck graphs to level up your calculator skills, and expand your knowledge of what is possible with the Desmos Calculator.

In this week’s offerings you’ll find a variety of graphs that range from artistic designs created using lists, to graphs that make use of parameters to control an animation.

Jenn Vadnais created this animation using tables and a single parameter to control the motion.

Paul Jorgens created this graph as an extension of the Origami Challenge that he uses in his Algebra class.

As with all Desmos Potlucks, we hope you’ll join in the fun! Here’s how you can participate:

  • Find a graph from the activity that interests you. Try to recreate that graph. If you need support, you can ask us on Twitter @desmos or take a look at the contents of the folder. Some folders are hidden from the student view, so feel free to make a copy of the activity and check the folder contents in authoring mode.
  • Let us know on Twitter which graph you recreated. What did you learn as you created the graph? Any surprises or challenges?
  • What dishes can you contribute?