Friday Fave for February 10

When others are giddy about an activity, the Friday Fave cannot help but get a
little excited, too.
Land the Plane is one of a suite of new activities we recently released.
The structure should be familiar. We get you started with an estimation task, then we get you to use algebra to increase precision and efficiency.
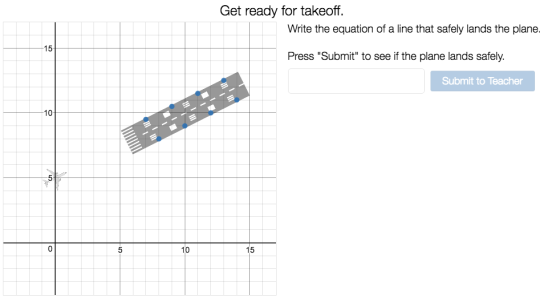
We ask students to imagine lines in their minds, and we ask them to write equations for the lines they picture. But we don’t tell them how to do it. Maybe slope-intercept form works best for you on screen 4, and standard form makes sense on screen 8, or vice versa. Maybe one student attends to the direction the airplane is pointing, and another notices the slope of the edges of the runway.
This is all fine, all supported, and is fodder for classroom conversations about equations of lines. Students practice, but not in a do it this way because I said so kind of way; they practice in a how can I get better at this fun task? kind of way. When students are wrong, the runway lights signal the plane to turn around, and their plane doesn’t land. Of course they get to try again.
Land the Plane is a brand new activity, but it has already been well received. Excerpts from a Twitter conversation:
“Runway lights” are genius! Making my son do this during
breakfast in the AM.
Brilliant concept. Executed well
Real math and real delight. A giddy combination. Go ahead and land the plane.