Explore this graph

Des-blog

Recent Posts

Notes from the Fellows Lounge

We pose a conversation starter in the Desmos Fellows program every week. It helps us reflect on practice and grow as teachers and technologists. In a recent prompt, we asked the fellows to share do’s and don’t do’s when designing Desmos Activities. We followed this prompt by asking the fellows the same question about how they teach with Desmos Activities.

The fellows reflected on how whole-class instruction differs when your activity is on a computer rather than on paper. Some highlights are below.

  • After giving students a chance to explore a topic, teachers can use the classroom conversation tools to bridge informal thinking to more formal ways of thinking about concepts.
  • The dashboard enables teachers to collect and act on student thinking through whole class conversation around misconceptions, making connections, and summarizing learning.

Check out what the Desmos Fellows had to say below around exploring, practicing, and summarizing with Desmos Activities.

Exploration

Many of us use Desmos Activities to introduce a concept. An introduction may include a series of exploration screens followed by a class conversation around how the exploration connects to the topic that students will study. Whole class instruction during the exploration phase of an activity may be useful in the following ways:

  • Paul Jorgens has used teacher pacing to take students through the initial exploration, sharing the overlay screen in order to help students make generalizations and explain their thinking.
  • Jenn Vadnais uses a cycle here called Interact - Process - Connect - Repeat. She helps students make connections through questioning and by organizing their thinking on the whiteboard. Check out her blog post for examples.
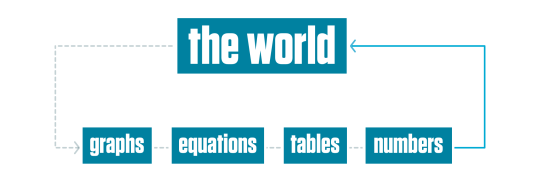
  • Lisa Bejarano has also used Desmos Activities to provide her students with a visual introduction that helps them build an informal understanding of the concept. She helps them think through how the concept works graphically, numerically and analytically, using the activity as a reference. Students then record these connections in a composition book. This is a strategy that can be used after the introduction or as part of the summary of the activity.

Practice

  • Mark Alvaro has bridged the transition from introduction to practice by modeling how to do a problem together so that students know what the expectations are. This is especially important when completing a problem can depend both on understanding the mathematics and on interacting with the technology in the appropriate manner.
  • Linda Saeta has used pause and teacher pacing to help students review specific screens. She noticed that after investing a lot of time on the first screens, the rest of the activity was more productive for students.

Summary

  • Dave Sabol likes to find places where the class can stop and collect thoughts and students can catch up on a topic. This might involve addressing misconceptions, or summarizing learning and making connections.
  • Anna Scholl likes to use card sorts to help students summarize their thinking and make connections.
  • Linda Saeta has used a Desmos Activity that spanned multiple days. At the end of each day, she picked out some of the student responses to use to start the next day. This helped students see all the correct ways to think about the problems and how to make answers more complete.
  • Bob Lochel aims for activities that build towards more open ended problems. He uses the dashboard of graphs as a gallery for students to discuss during the summary portion of the lesson.
  • Sarah Vandivort has also used Activity Builder for whole class summary, choosing a key screen towards the end of the activity to launch the summary discussion.
  • Nick Corley uses Polygraph: Lines at the beginning of his unit on Linear Functions in Algebra 1. In this activity students who had prior knowledge played with students who didn’t, and their vocabulary transferred from one student to another. Nick noticed that by the end of the activity most students were using words like slope and intercept. He used the teacher dashboard to foreshadow some topics and to start to introduce the vocabulary of the chapter.

What are some other ways in which we might use a Desmos Activity for whole-class instruction?

Friday Fave for October 21

image

In Marcellus the Giant, students learn what it means for one image to be a “scale” replica of another. They learn how to use scale to solve for missing dimensions in a proportional relationship. They also learn how scale relationships are represented in a graph.

There are three reasons we wanted to bring this activity to your attention today.

First

Marcellus the Giant is the kind of activity that would have taken us months to build a year ago. Our new Computation Layer let Eli Luberoff and Dan Meyer build it in a couple of weeks. We’re learning how to make better activities faster!

Second

When we offer students explicit instruction, our building code recommends: “Keep expository screens short, focused, and connected to existing student thinking.”

It’s hard for print curricula to connect to existing student thinking. Those pages may have been printed miles away from the student’s thinking and years earlier. They’re static.

In our case, we ask students to pick their own scale factor.

image

Then we ask them to click and drag and try to create a scale giant on intuition alone. (“Ask for informal analysis before formal analysis.”)

image

Then we teach students about proportional relationships by referring to the difference between their scale factor and the giant they created.

You made Marcellus 3.4 times as tall as Dan but you dragged Marcellus’s mouth to be 6 times wider than Dan’s mouth. A proportional giant would have the same multiple for both.

Our hypothesis is that students will find this instruction more educational and interesting than the kind of instruction that starts explaining without any kind of reference to what the student has done or already knows.

That’s possible in a digital environment like our Activity Builder. I don’t know how we’d do this on paper.

Third

Marcellus the Giant allows us to connect math back to the world in a way that print curricula can’t.

Typically, math textbooks offers students some glimpse of the world – two trains traveling towards each other, for example – and then asks them to represent that world mathematically. The curriculum asks students to turn that mathematical representation into other mathematical representations – for instance a table into a graph, or a graph into an equation – but it rarely lets students turn that math back into the world.

image

If students change their equation, the world doesn’t then change to match. If the student changes the slope of the graph, the world doesn’t change with it. It’s really, really difficult for print curriculum to offer that kind of dynamic representation.

But we can. When students change the graph, we change their giant.

image

There is lots of evidence that connecting representations helps students understand the representations themselves. Everyone tries to connect the mathematical representations to each other. Desmos is trying to connect those representations back to the world.

Friday Fave for October 14

The Friday Fave is delighted to bring you a trio of activities this week, inspired by Stefan Fritz, and edited with a good deal of love by Desmos.

In Inequalities on the Number Line, we start simply and informally. Move the point to show a number less than three. Any number less than three is good, although we encourage students to pick a number that their classmates won’t.

image

We’re building towards asking them about all numbers that are less than three, of course. But the formalities of the symbolic and graphical representations of this idea can wait because we want to build on what they know. One number, then three numbers, then all of the numbers your classmates picked.

image

We build on this representation in order to introduce the shaded number line, and even the open dot for strict inequalities.

image

Another quality making this set of activities a fave is that students do many kinds of things in each activity. They plot points. They engage in card sorts. They interpret number line representations as inequalities. They look for similarities and differences among a set of inequalities.

These activities represent some of our best thinking about the interactions between students’ informal mathematical ideas and the formal representations they need to learn, and about using electronic tools to engage students in meaningful mathematical activity.

But don’t take the Friday Fave’s word for it. Here are links to the whole set:

Inequalities on the Number Line

Compound Inequalities on the Number Line

Absolute Value Inequalities on the Number Line