Explore this graph

Des-blog

Recent Posts

Teacher Tales: Using Common Core? You need Desmos!

by Matt Owen, Algebra 1 and Physics Teacher at Lusher Charter School, New Orleans, LA

Here are just a few of the ways I’ve used Desmos in my class along with the CCSS Math standards that apply.

1) Recognizing that graphing the functions f(x) = 3x - 4 and g(x) = 6 gives you the solution to 3x - 4 = 6. I used to think that this was a waste of time, since solving this algebraically seems easier. But having the resource of Desmos there (that kids like using and see the value in), makes it simple for them to see the connection. Then when we go to solve |x-3| = 7, they can find the solution graphically first and work up to an algebraic solution. Same goes for exponential, quadratic, anything! I never placed much emphasize on graphical solutions until we starting using Desmos regularly. But it’s even a CCSS! Check it:

A-REI.11 states: Explain why the x-coordinates of the points where the graphs of the equations y = f(x) and y = g(x) intersect are the solutions of the equation f(x) = g(x); find the solutions approximately, e.g., using DESMOS to graph the functions, make tables of values, or find successive approximations. Include cases where f(x) and/or g(x) are linear, polynomial, rational, absolute value, exponential, and logarithmic functions.

(I may have made a small edit there) ;)

2) Finding a fit line and then adjusting a fit line (Are you doing Barbie Bungee this year? Me too!) This one is so easy to do with Desmos. The one I did last year was ok; I had the kids measure their arm length (from elbow to fingertip) and their foot length (no shoes, heel to big toe). Once each group was done measuring, they came up and entered their data in Desmos on my computer which was projected on the board. It looked like this. Then we discussed the best model to use here (linear was easy to agree on) and used that. Then it looked like this. So then I just shared that graph with every group (I used email to send it out, but Google drive may be an easier way to share), and had them write the equation of the fit line as they saw it. The great part here is that each group comes up with a different equation. Then, I had each group make a prediction about my arm length given my foot length and we could see who was closest. It’s a nice way to add a little friendly competition and get to discuss why the best prediction was the best. This is also a good place to discuss the meaning of slope and y-intercept. Should the y-intercept be zero? Does the slope have units? There’s really a bunch of CCSS that go with this one, but mainly I was thinking:

S-ID.6: Represent data on two quantitative variables on a scatter plot, and describe how the variables are related.

  1. Fit a function to the data; use functions fitted to data to solve problems in the context of the data. Use given functions or choose a function suggested by the context. Emphasize linear, quadratic, and exponential models.

  2. Informally assess the fit of a function by plotting and analyzing residuals.

  3. Fit a linear function for a scatter plot that suggests a linear association.

3) Exploring function graphs. Check out Building Functions 3:

F-BF.3: Identify the effect on the graph of replacing f(x) by f(x) + k, k f(x), f(kx), and f(x + k) for specific values of k (both positive and negative); find the value of k given the graphs. Experiment with cases and illustrate an explanation of the effects on the graph using technology. Include recognizing even and odd functions from their graphs and algebraic expressions for them.

OMG! That’s so complicated sounding! But if you have students build on a parent function, they’ll start to be able to tell the difference between f(x) + k and f(x+k) even if that’s not how they’d explain it. Here’s the handout I used to do vertex form quadratics last year (needs a little work, but I think you’ll get the idea). Once they’d built up some rules for how to shift the graph around, I could show them the general vertex form graph and they could make some predictions about what the a, h, and k would do. Bam! Function built!! (of course that’s not the end of our quadratics explorations – it’s the beginning!)

Interested in sharing your classroom experiences? Email us at calculator@desmos.com

Teacher Tales: Using Desmos to Ensure All Students Have Success

by Lee Bissett, Algebra 1 and Pre-Algebra Teacher at Lowell School, Washington, DC

Lowell School is an independent, progressive day school in Washington, DC. Our progressive values encourage teachers to take risks and break from traditional practices when 21st century learners need new models of teaching and instruction. For many years, our school taught grades pre-K through 6th. A few years ago, our head of school decided to expand the school through 8th grade and formally separate 6th through 8th grade into a middle school.

In May of 2011, I was brought in to establish Lowell’s middle school math program. Because middle school math includes introductions to both algebra and geometry, one of the first decisions I needed to make related to graphing calculators. Lowell has always strived to provide each student with a school-issued laptop and when I arrived, was beginning to transition towards school-issued tablets for students. For me, the advantage of the tablet in education has always been that it can serve as a student’s planner, textbooks, calculator, and myriad other functions. A traditional graphing calculator is simply that – just a calculator.

So when our head of school asked me how much money she needed to budget to purchase graphing calculators, I asked her to hold off until I could explore some of the available web-based graphing calculators and graphing calculator apps. Given our progressive nature, she understood and encouraged me to choose a program or app that would meet the needs of all of our students. I experimented with several and discovered Desmos in August of 2011.

I was immediately struck by the things Desmos could do that traditional graphing calculators couldn’t. It seems trivial, but for middle school students who are just beginning to explore concepts like slope and intercepts, the ability to color code equations and their graphs is immensely important. Furthermore, the ability to see functions and relations in tabular, equation, and graphical form simultaneously on one screen is a tremendous advantage over traditional graphing calculators. While I could write extensively on the reasons I chose Desmos for our students to use as their primary graphing calculator, I instead want to discuss how Desmos’s clean, organized visual interface can help one particular type of student to excel.

This type of student is very bright, regularly scoring well on standardized math tests with the aid of a calculator, but has visual challenges that interfere with traditional algebraic manipulations. Students with this profile usually need to use graph paper to keep work organized on the page and have difficulty plotting points on the Cartesian plane because it requires a level of visual precision that they can not reach.

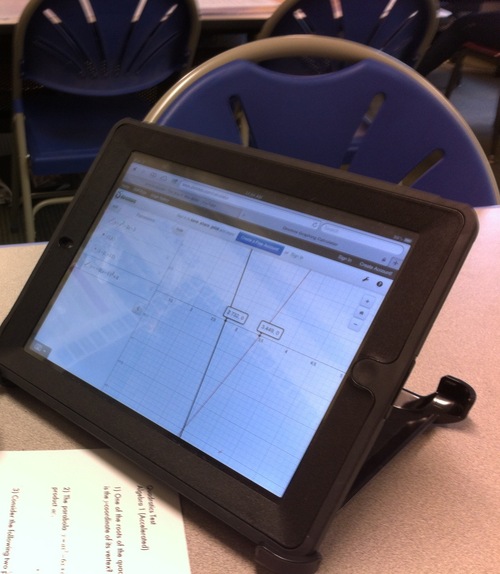
Using Desmos to work through Algebra has been fantastic for this particular type of student given their difficulties with the traditional approaches to mechanical and visual manipulation of expressions and equations. In order to fully illustrate how using Desmos has allowed this type of student to be successful, here is a copy of a recent test along with several photos (below) of how the problems are tackled with Desmos. For each problem, students were only allowed to use the calculator component of Desmos and not the concepts page, so they still had to have a solid grasp of all the quadratic concepts in order to piece together the question and the solution approach.
image

For problems one and two, students can use the built-in sliders to find the answers without having to perform all of the algebraic manipulations, which could be prohibitively difficult for them. For problem one, if the student knows that a root is where the parabola crosses the x-axis, it is very simple to graph the parabola using a slider for the value of c, then adjusting the slider until one of the roots is –3. For problem 2 as long as the student knows that for a parabola to have only one real root its vertex must sit on the x-axis, the student can use the sliders for a and c to determine appropriate values of a and c that result in the parabola having only one real root.
image

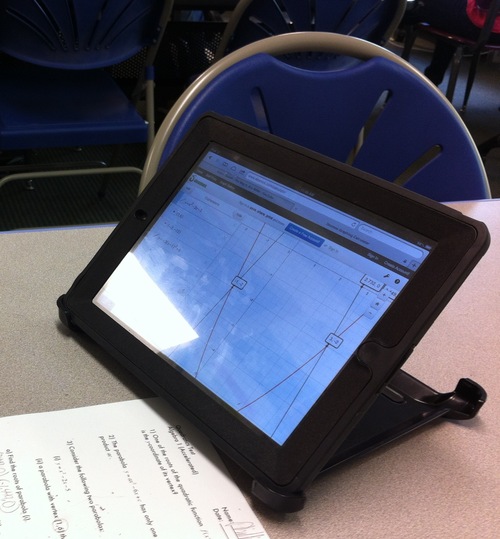
For the third question, students can easily plot the first parabola. For the second parabola, students can first put the points on, then do some basic algebra with vertex form and graph the parabola. They are quickly able to check that they’ve done it correctly because they can see that the graphed parabola passes through the points they have put on the graph. This level of precision and the ability to easily zoom allow students to check their work; doing so on paper would not be easy for students with visual issues who typically struggle with algebraic manipulation. Thus, the rest of question 3 is simple for these students to attack given their understanding of the two concepts required.

Finally, for the fourth question, students can draw a rough picture and then use Desmos to make it accurate. Just like the previous question, they are able to plot the points and then determine the equations that pass through those points. Once they have the equations, they can easily graph them and immediately see if they are correct by checking to see if they pass through the points they previously plotted. Finding the intersection of the two equations, and thus the conditions the programmer would need, is quite simple.

I cannot stress enough how Desmos has allowed this particular type of student to be successful not only on this test, but in Algebra as a whole. While they may not always be able to use pencil and paper to algebraically find the intersection of two parabolas, the reality of the “always on” 21st century is that they won’t need to be able to in order to have success in a math-based field. Having a firm understanding of the concepts required and an intuitive, user-friendly program that can quickly find solutions allows them to apply concepts in appropriate ways. To wit, one particular student I taught this past year is interested in becoming a computer programmer. Tools like Desmos ensure that he will be able to solve programming challenges quickly and efficiently. Without Desmos and the ways in which it has helped him be successful, this student might have missed out on the richer aspects of math that he will hopefully use in his career as a programmer.

Interested in sharing your classroom experiences? Email us at calculator@desmos.com

Teacher Tales: Trinomial Factoring in Algebra I

by David Wright, Algebra 1 and 2 teacher at Jesuit Dallas

About Me: I’ve been teaching for 20 years and currently teach algebra I and II at Jesuit Dallas, a one-to-one iPad school. Last year, I ran across an article in the paper about a revolutionary, free, web-based calculator called “A Better Calculator.” I googled it and found Desmos. Desmos has transformed my classroom. This is a lab I created and wanted to share with everyone. Please feel free to copy and use it.

I introduce my students to factoring through finding the GCF - both monomial and binomial factors. First, I go through the process of factoring a trinomial. After introducing this and going through the monotony of factoring multiple problems in homework, I use Desmos to re-energize my students. Desmos eliminates the abstractness that comes with mathematical processes and allows the students to play with the numbers. With Desmos, the students can see something tangible happen to the corresponding graph, and I can guide them in the direction I want to take them.

In this lab, I’m looking for the students to see the connections between the factored trinomials and the points where the parabola crosses the x-axis. Even though we’re discussing factoring, I get to introduce the concept of the zeros of the function and I can even incorporate the idea of the double root. We use previous homework problems, which have already been checked in class, to develop a hypothesis about the zeros of the function with the corresponding binomial factors. The students recognize the connection between the standard form of a quadratic function and the factored form for the function. They see this connection as a way to check their work. However, I see it as a way to pull together mathematical concepts that will be discussed in later chapters (solving quadratic equations and finding the x-intercepts when graphing a quadratic function). It also reduces the numbers of students who ask, “Why do I need to be proficient in factoring?” or “Will I really need to do this in subsequent chapters?”

One pleasant surprise this year was that my super-star students wanted to take the concepts further. I didn’t want to expand this topic beyond its scope because I didn’t want to overwhelm the other students. However, they began discussing the possibilities of the graph not touching the x-axis or having more than 2 places where the graph touched. It was very insightful on their part. With Desmos, I could still engage those students while I was working with others who were struggling.

I hope you take the time to look through the lab (here) and give it a try with your students. Please feel free to send feedback to me at dwright@jesuitcp.org!

Interested in sharing your classroom experiences? Email us at calculator@desmos.com