Explore this graph

Des-blog

Recent Posts

Introducing Movable Points!

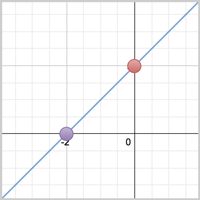
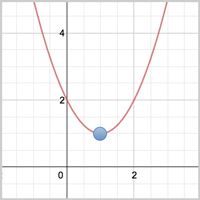
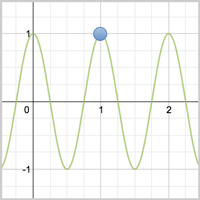
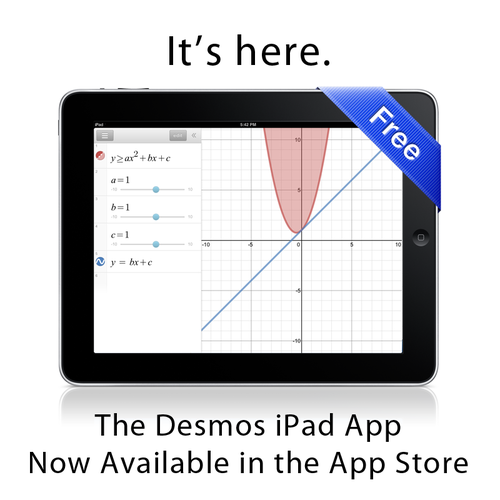
Desmos Labs has been churning away at full speed for the last few weeks: hot on the heels of our very first iPad app (check it out here), we’re thrilled to announce movable points! One of our most highly requested features, you can now click and move points around directly on your graph while the values automatically update in your expressions list. Link those points to other expressions and watch the graphs change as you move the points around.

To use this new feature, create a point where either or both of the coordinates are sliders. Then, just click and move the point directly on the graph paper.

Here’s a quick How-To to get you started:

Click on any of the example graphs below to explore movable points (warning: very fun):

image image image

Can’t wait to see the amazing graphs you create with them!

The Desmos iPad App Is Here!

image

We’re thrilled to announce our very first iPad app! Starting today, students, teachers, and math enthusiasts can explore math through Desmos without the need for an internet connection – or an expensive hand-held graphing calculator. The app features many of the familiar elements of desmos.com, but with dozens of built-in examples, an enhanced design, and offline support. With this launch, we move one step closer to giving everyone the ability to explore the richness of mathematics in the palm of their hands, wherever they are.

This is just the beginning for Desmos on mobile devices. As always, we appreciate your feedback as we continue to make this app even better.

Download the free app here: https://itunes.apple.com/us/app/desmos-graphing-calculator/id653517540?mt=8

Polar Axes Are Live!

image

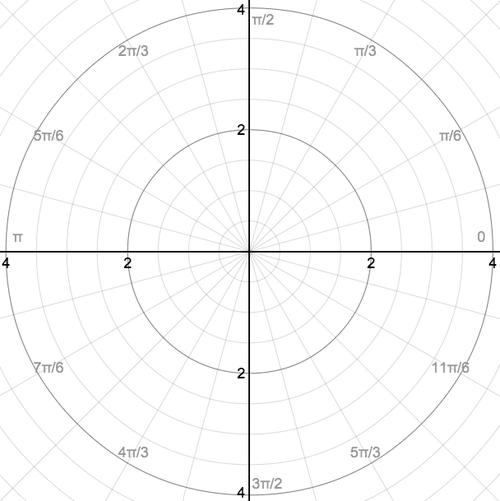
Brrrr! Piping cold out of Desmos Labs: Polar Axes! Although graphing polar functions has been possible since Desmos went live, you can now switch from Cartesian to Polar graph paper to better visualize your polar equations.

As opposed to the standard x / y coordinates, polar graphs are constructed in terms of the radial distance from the origin ®, and the angle from the x-axis (θ). The r value is measured by the concentric circles you see above, while the θ value is indicated by the lines radiating out of the origin.

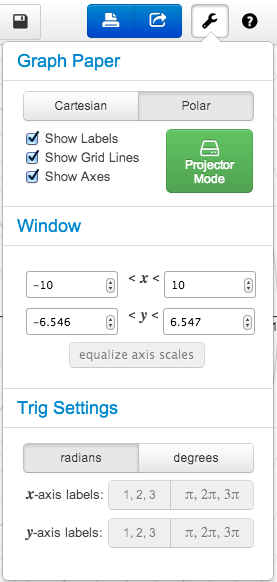
Activate Polar Axes by clicking Options (the wrench icon at the top right of the calculator), and then toggling Polar. Then, just start entering expressions in r / θ (type “theta”) notation to create beautiful polar graphs. Click on Options again and look under Trig Settings to switch between Radians and Degrees for maximum flexibility:

image

Below are a few examples of graphs displayed on the new axes:

image

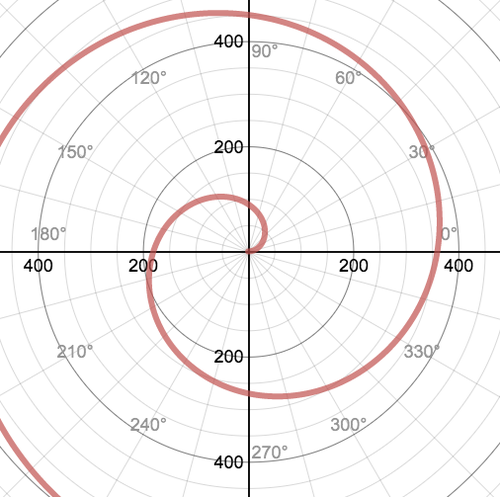
r=θ (in projector mode / degree mode)

image

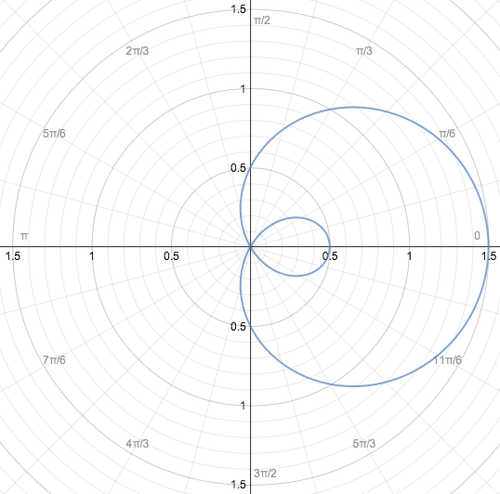
r = 0.5 + cosθ (a limaçon)

image

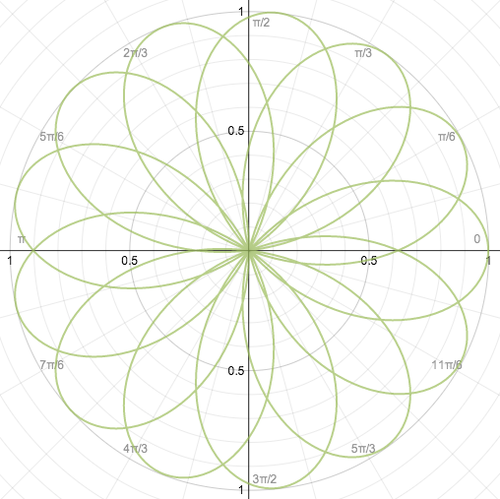
r= cos(13/7*θ)

image

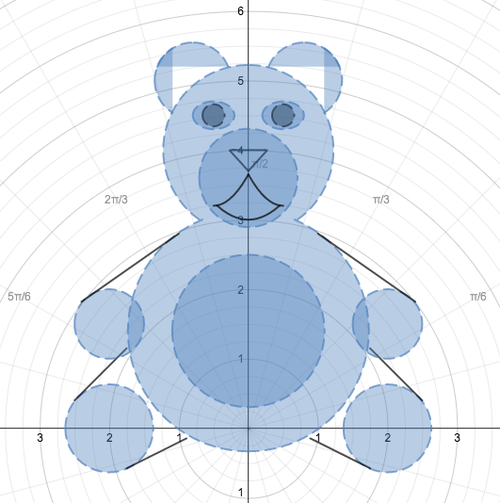
A “Polar” Bear! (original by Desmos user Sydney from Tennessee)