Explore this graph

Des-blog

Recent Posts

We need your #Crunchies vote!

Each year “deserving startups, tenacious entrepreneurs and clairvoyant investors” are nominated for a Crunchie Award for making waves in the tech scene. This year, we’re excited to be in the running for Best Education Startup – and we need your vote to win! A brand new category, this award recognizes the best startup focused on education technology applications. If you enjoy graphing with Desmos, please show us some love and cast your vote!

Click here to vote for Desmos as Best Education Startup

You can vote daily through Monday night, December 26th at midnight. After casting your vote be sure to share your nomination on Twitter and Facebook - we’ll keep a look out for these :)

Thanks for your support!

- Team Desmos

The Crunchies are Hosted by TechCrunch, GigaOM, and VentureBeat.

How To: Graphing Inequalities

Graphing Inequalities

Adding colored shading to your Desmos graphs is easy with inequalities. Use < and > for strict inequalities (dotted line), and <= or >= for non-strict inequalities (solid line). Check out the video below for a quick demo.

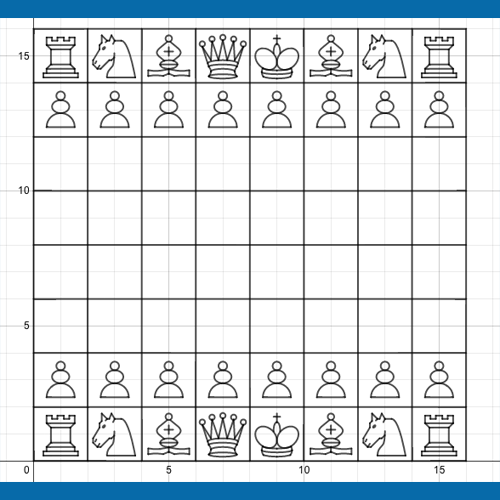
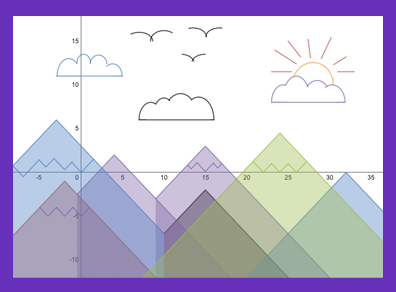
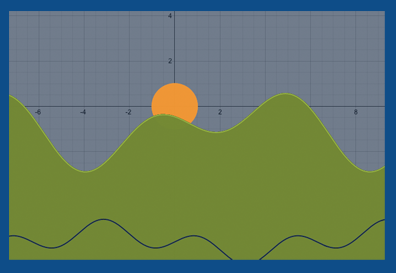
Now that you know the basics, kick your shading skills up a notch! Here are some creative uses of inequalities for some graphing inspiration. What can you create?

Mountain Sunset - by Adrienne

https://www.desmos.com/calculator/qnaua1blyq

Lovely Evening

https://www.desmos.com/calculator/cpolo6rx1g

Find even more examples of inequalities on our Pinterest page. Let us know what you think! Tweet us @Desmos or shoot an email to calculator@desmos.com.

How To: Points of Interest

Have you ever wondered how to find points of interest on Desmos? It’s easy! Watch the brief video tutorial beneath this post for a quick rundown of how to find maxes, mins, intercepts, and intersections between several expressions.

Now head to the calculator and give it a try. You can start with this graph of wave interference:

Click on your curve or the equation to display its Points of Interest. Drag the “a” slider to watch the phase difference increase and decrease between the two curves. As you do this, what happens to your POIs? Pretty cool, right?!

Click here to explore Points of Interest on some of our other favorite graphs. Let us know what you think! Tweet us @Desmos, post to our Facebook wall, or shoot us an email at calculator@desmos.com.