Explore this graph

Des-blog

Recent Posts

Desmos in Action - Clarksville, AR

At last summer’s ISTE conference we met many wonderful teachers looking for new educational tools they could bring back to their classrooms.

Here’s one story from Laura Conley (teacher at Clarksville Public Schools, Arkansas) about how she began using Desmos this year with her math and ESL students.

Reblogged from lconley86.blog.com

While attending ISTE 2012 in San Diego this summer I visited the booth of Desmos.com. Since I work with high school students in 3 different math classes I was very interested to see what they had to offer. It was more than interesting! I was in awe watching how fast an equation could be graphed.

After only 5 weeks of school Desmos has become part of our vocabulary at Clarksville High School! The home page of Desmos.com states “Beautiful, Free Math”. I think this is a perfect description. We use it almost daily in Algebra 2, Calculus, and Transition to College Math. All of our classrooms are equipped with Smart Boards so when we project Desmos for the class it is a great visual. The students and staff love how fast it is also. It’s creating a line while you are typing in the equation. It’s a great to watch it change during this process. Students can really “see” the line being graphed unlike on a regular graphing calculator. If you are graphing more than one equation you may want to try this:

  1. Type in each equation.
  2. Turn all the equations off by touching (on the iPad) or by clicking (from your desktop or laptop) on the small sqaare with a line in it in front of your equation. (This sounds harder than it really is!)
  3. Then turn one equation on at a time to see exactly where the solution area will be. You can also change the color of the lines for an even better visual.

I use this simple easy method to visually teach this to all students. It is especially effective for our ESL students. This could never be achieved with a regular calculator because of the display size and it doesn’t offer the color display that Desmos does.

Read the rest of Laura’s story on her blog (lconley86.blog.com) and be sure to join her on Twitter, @lconley86

—-

Amazing stories like these are what keep us motivated at Desmos. Teachers, if you have similar stories to share about using our calculator, let us know on Facebook, Twitter, or at calculator@desmos.com! We’d be more than happy to set up a conference call to help you make the most of Desmos in your classrooms.

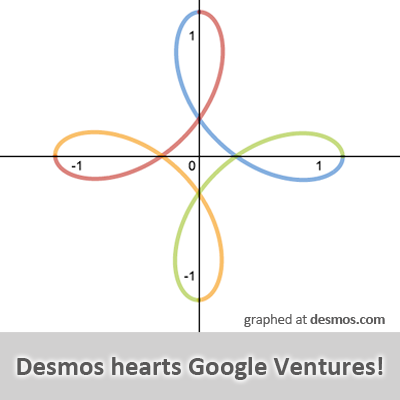
Desmos Hearts Google Ventures!

This week we’re excited to become part of the Google family with additional funding from their startup venture fund, Google Ventures. Thanks to this additional support we plan to continue making math fun, accessible, and collaborative without the need for expensive, proprietary hardware. Because, who wants to spend $100+ on a graphing calculator, right?

“Today technology is rapidly redefining traditional education,” said Rich Miner, partner at Google Ventures. “Math is a subject area where we lose many of our students and our competitive edge. If math can come to life, as Desmos is doing, we can build a generation of students that is engaged and deeply interested in the areas of math and science. We are excited to be working with Desmos as they scale their operations to have an impact on students around the world.”

Since unleashing the calculator in early 2011, we’ve felt the love from math-enthusiasts near and far. Our users span over 150 countries around the world and thanks to them, we’ve seen dedicated users push our software beyond what we thought was possible.

With the school year kicking back into gear, we’ve seen a surge in teachers and students using Desmos for creative, project-based assignments. In a recent final project for an Algebra II high school class in Florida, students were challenged to draw Mickey Mouse using circles and ellipses. Over 2,000 different Mickey Mouse graphs were created in a week. Since then, users have built intricate graphs of cartoon characters, super heroes, animals, and anything else you can imagine.

Luke Walsh, a mathematics instructor at Catawba Valley Community College in North Carolina, uses Desmos for project-based learning and discovery for his classes. Walsh commented, “The iPod revolutionized the way people listen to music and Desmos is revolutionizing the way people visualize mathematics. As soon as students begin typing, mathematics is displayed to them in color, and they quickly become engaged by amazing features, such as dynamic sliders and points of interest. Desmos soars past the definition of a graphing calculator.“ Tweet Luke at @LukeSelfwalker.

Stay tuned for more exciting announcements in the coming months.

Happy graphing everyone!

Desmos in the Classroom

For those of you following us on Twitter, you know we love hearing stories of your students using Desmos. And when we actually get to see this in action, whoa that’s a treat!

Last week, several teachers who recently added Desmos to their teaching toolbox tweeted snapshots of just this.

First up is Allison Morris, aka @amorris426:

Next, Devin Shoening, from Council Bluffs, Iowa (aka @dschoening):

And finally, Rebecka Peterson, aka @rebeckamozdeh, a math teacher from Oklahoma who created a trigonometry lesson with Desmos:

We’ll be sharing more photos as they come in. If you have any you’d like to share, tweet them to @Desmos, post them on our Facebook wall, or shoot us an email.

Interested in using Desmos with your classroom? Teachers - set up a free web demo with us for you and your colleagues and receive some awesome perks. Learn about Desmos from its creators, revamp your lesson plans, and see how our calculator makes teaching math more fun and engaging. Send us an email to get this set up!