Explore this graph

Des-blog

Recent Posts

State of the Desmos

Hi mathlings! It’s been over a year since we launched at TechCrunch Disrupt NYC, where we first unveiled our browser-based education software. Today, our founder & CEO, Eli, sat down with Jordan Crook at Disrupt SF to talk about Desmos, the calculator, and what’s ahead. Check out the full video below:

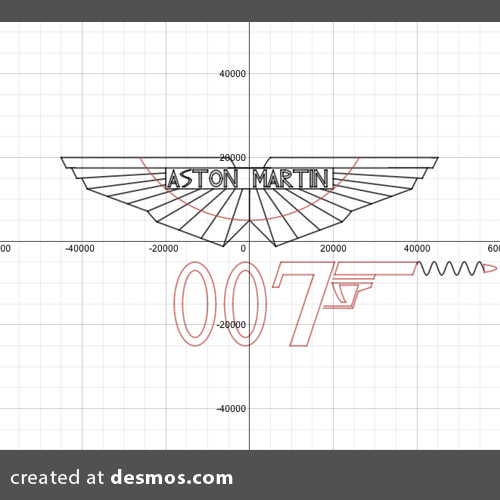
When we first started focusing on building a web based calculator, we planned on modeling the software on the current hardware out there, since it was what people were familiar with. For example, we thought we’d only show about 10 equations at a time (why would you ever need more than that?). We were quickly convinced otherwise. After Desmos power user Shaunak graphed the Aston Martin logo with 100 expressions, we realized that the potential for creating mathematical art was astonishing. We decided to let go of any preconceived notions of how a calculator should look and act, and build something completely new.

For the record, the most equations to date in a graph is 480, in a fantastic chess board creation by Eric. Can you beat that? Hint: try a cartoon character - those are among the most intricate and stunning graphs we’ve seen!

In short, we’ve learned, changed, and grown a tremendous amount since our launch last year, and we have our wonderful users to thank for that.

Back to School with Desmos

It’s the end of August, so you know what that means…National Trail Mix Day on August 31st! It also happens to be our favorite time of year here at Desmos - Back to School!

To some students, this means a new Spiderman lunchbox or set of limited edition colored pencils. For teachers, it’s time to get the lesson plans in order, finish up the summertime PD, and greet the next group of kids.

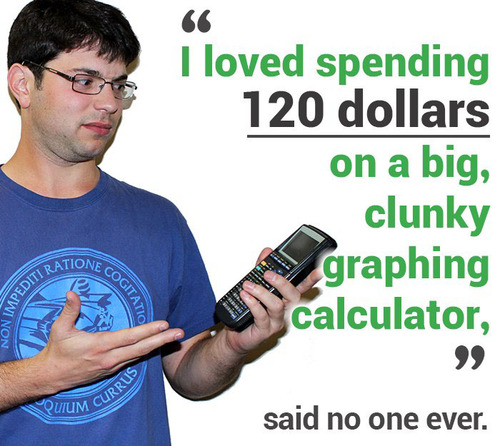
To many students, Back to School translates to an exhausting search through the depths of dimly lit basements to find their dusty old graphing calculators. If this fails, it means dropping a chunk of that hard-earned summer cash on a clunky calc.

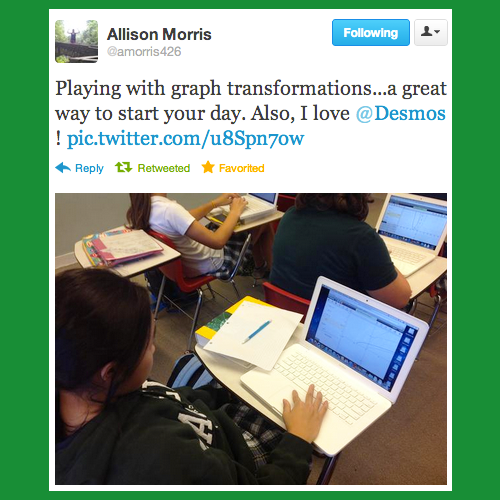
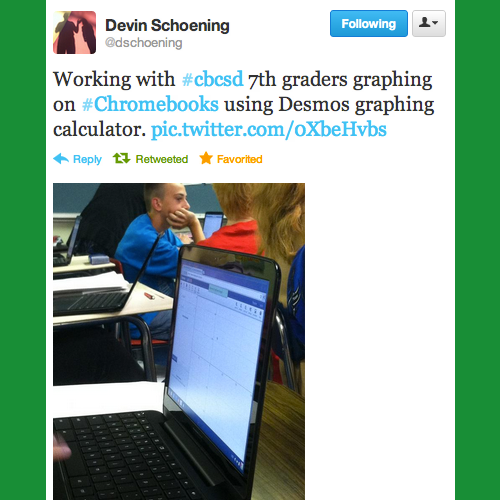
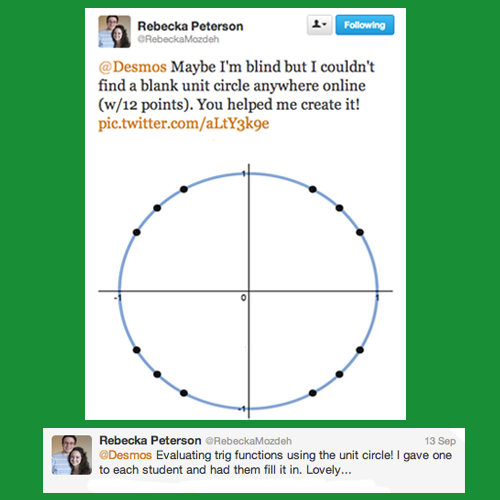
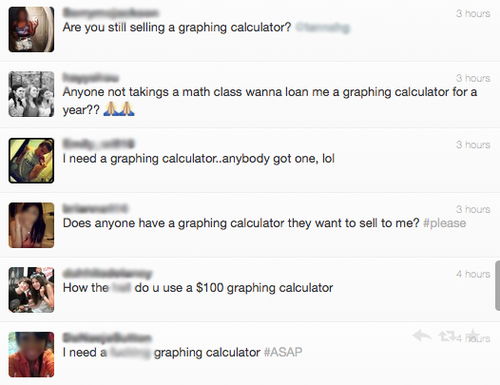
Students have said it themselves - check out what’s happening on Twitter. Battery issues, money woes, and general panic. (For more, just search “graphing calculator”… people come up with creative ways to express their disdain!)

Yikes. Luckily there’s another way. At Desmos, back to school means one thing - making our calculator your go-to tool for math exploration. In honor of Back to School, we’re on a mission to show teachers, students, and math enthusiasts that there’s something better out there.

Share the math love! Teachers - set up a free web demo with us for you and your colleagues, and receive some awesome perks. Learn about Desmos from its creators, revamp your lesson plans, and get a sweet package of Desmos goodies!

Message us on Facebook, Twitter, or via email to schedule.

Let’s kick off the school year in style.

Curiosity Inspired Graphs - Our Graphing Contest Winners!

NASA’s wildly successful landing of Curiosity last week garnered the attention of space enthusiasts around the world. For Team Desmos, it was especially amazing to see how this Mars mission rejuvenated an interest in learning math and science. Whether it was the cool NASA Mohawk guy or the excitement of seeing the first images of Martian terrain sent back to Earth by Curiosity, one thing is for sure: this little red rover is a shining example for students of how science, technology, engineering, and mathematics (STEM) can turn science fiction into science fact.

Last week we joined the Planetary Society and their awesome CEO, Bill Nye the Science Guy, to test our users’ math skills with a space-themed graphing contest. Not only were the graphs we received chock full of technical firepower – our users really let their imaginations run wild. They showed us how the Desmos graphing calculator is a learning tool with endless opportunities for exploration, discovery, and fun.

We’re excited to announce the winners of the Curiosity-inspired graphing contest below – all of whom will receive an autographed photo from Bill Nye the Science Guy and other goodies from us here at Team Desmos. Thanks to everyone who participated!

1. “Orbit” by Keith R. – A college freshman in Florida studying Aerospace and Mechanical Engineering.

Take a look at Curiosity entering the Martian atmosphere and deploying its supersonic parachute! Turn on Projector Mode for a better picture.

View his equations here: http://goo.gl/vJ8co


2. “The Solar System on Bill Nye’s Birthday (Nov. 27, 2012)” by Asa R. – A high school student in Massachusetts

In his graph, Asa attempted to create the planets to scale (with the exception of the sun, it’s huge!). Nice work!

View Asa’s equations here: http://goo.gl/fzEQB

3. “Journey from the ‘Pale Blue Dot’” by Luke W. – A math instructor at Catawba Valley Community College

Move the slider in Luke’s graph to watch Curiosity travel from Earth to Mars during its 254-day journey!

View Luke’s equations here: http://goo.gl/5zUfp


And winners – if you’re reading this, please send us your mailing addresses so we may get your prizes shipped out! Email us at calculator[at]desmos.com.

Thanks again,

Team Desmos

Join Desmos on Facebook

Follow us on Twitter

Launch the calculator