desmosify Posts

Paint #Desmosify

Welcome to a series of posts sharing how we #Desmosify the curriculum from Open Up Resources/Illustrative Mathematics. You can use this lesson for free, or sign up to get many more activities just like it in our core middle school curriculum!

Here’s how we #Desmosified an Open Up Resources/IM lesson introducing students to equivalent ratios.

Desmosification #1: Create concrete connections.

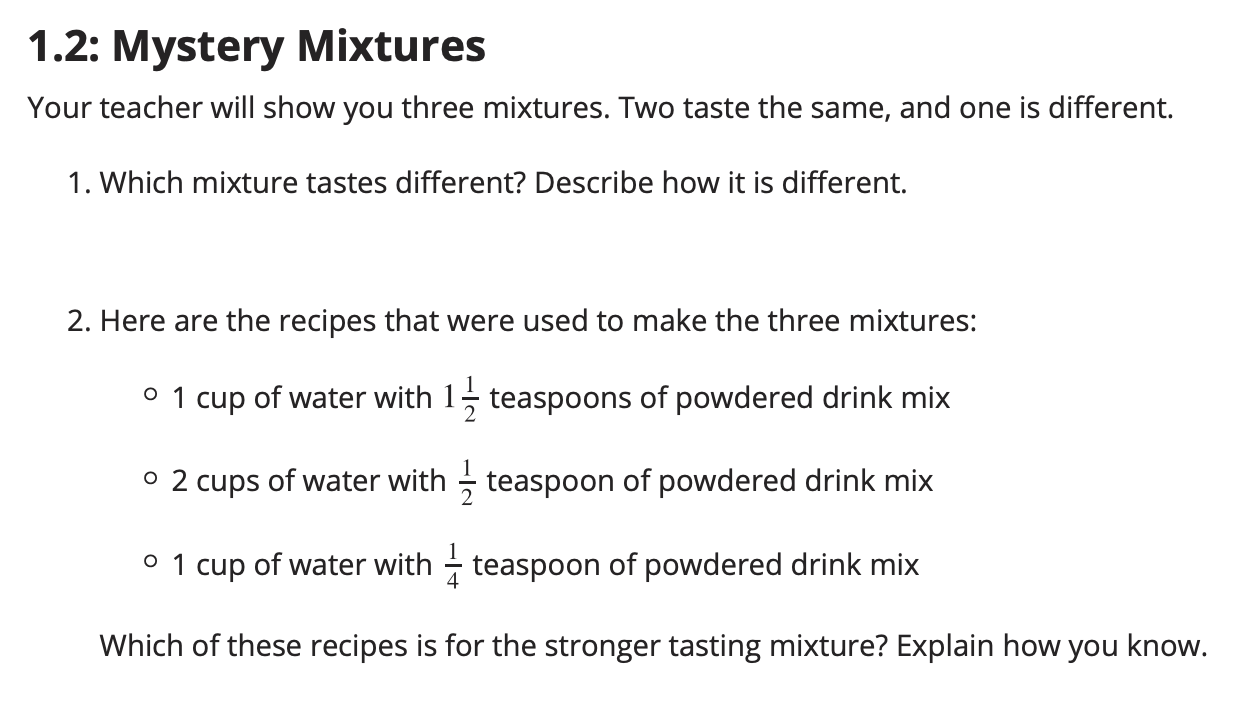
The original lesson we #Desmosified seeks to connect a student’s understanding of ratios to the taste of a drink. Helping a student connect their developing knowledge to some piece of concrete knowledge is a great way to strengthen both.

The original lesson.

Read more

Flags #Desmosify

Welcome to a series of posts sharing how we #Desmosify the curriculum from Open Up Resources/Illustrative Mathematics. You can use this lesson for free, or sign up to get many more activities just like it in our core middle school curriculum!

Here’s how we #Desmosified an Open Up Resources/IM lesson about vertical intercepts.

A line translating up a graph.

Desmosification #1: Connect math to the world and back again.

A conviction we share with Open Up Resources/Illustrative Mathematics is that math learning is more durable and more interesting when students get opportunities to connect mathematical representations.

In their original lesson, OUR/IM invites students to connect together text and graphs.

Text-based card sorts.

So we were excited to use our digital technology to invite students to connect graphs and a dynamic animation.

Read more

Fit Fights #Desmosify

Welcome to a series of posts sharing how we #Desmosify the curriculum from Open Up Resources/Illustrative Mathematics. You can use this lesson for free, experience it in a live show next week, or sign up to get many more activities just like it in our core middle school curriculum!

Here’s how we #Desmosified an Open Up Resources/IM lesson about fitting lines to data.

Desmosification #1: Collect and connect student creativity.

In the original lesson, students draw a line based on data that are tightly correlated and then loosely correlated. Ideally, they’d notice how the spread of the data makes fitting a line easier and harder.

Two graphs on a paper worksheet.

“Compare [your lines] with a partner’s,” asks the lesson, a question which under really good conditions will result in useful learning. But what if your partner hasn’t drawn a line yet? What if you and your partner have a very similar or very different line? What if you’re learning virtually during a pandemic?!

On Desmos, we ask students to draw the two lines and then … we collect and connect all of them.

Read more