Explore this graph

Des-blog

Recent Posts

Teacher Feature: Channeling Creativity in Algebra II

As we’ve said before, there’s nothing that motivates us like hearing from real users. Last week we received a note from Bob Lochel, a Philadelphia teacher who combined Desmos, a conics lesson, and his students’ creativity in an artistic Algebra II project.

Thanks to Desmos’ ability to save graphs for users to return to later, his students were able to begin their projects in the classroom, but then really let their ideas fly when they revisited their work at home, at their own pace.

Read Bob’s story below and follow him on Twitter, @bobloch

Reblogged from mathcoachblog

One of my favorite math projects takes place during our unit on conic sections in Algebra II. In the project, students are challenged to manipulate equations of conics and graph them using software to make pictures. I started with this project 12 years ago when a colleague, who has since retired, introduced me to his ideas. Back then, we used a DOS program which could only graph in black, cyan and magenta. We were happy if we saw a tree made from a hyperbola and a parabola leaf line.

The project grew new wings with a program called Math Toolkit, which allowed for finer graphing and the ability to save work. Later, we started using Print Screen to grab the graphs and move them into MS Paint. The projects grew more intricate, and many kids took off with their creativity.

This year, the Desmos online calculator brought the project to a new level. Students this year could work on their equations at home, save work, and work with their teacher during time allotted in class. Thanks to Kevin for working with his class to share their creations.

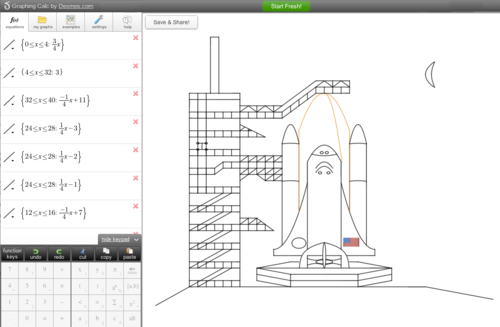
First up is Kristin. Her project moves from Desmos to Paint. Then un-needed pieces are removed, and the final product emerges.

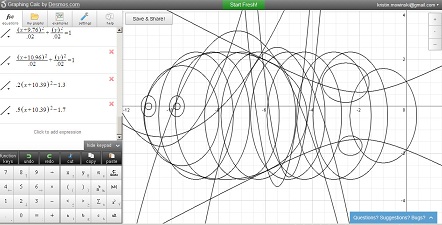
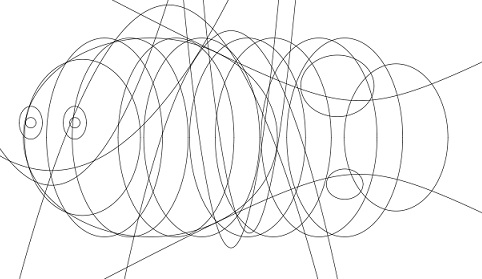
Next up is Matt. Here are his graphs after the axes and grid were removed….

Any ideas what the finished product will be?
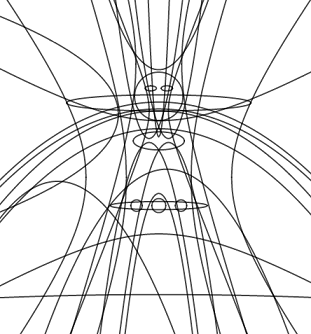
Did you guess yet?

To see the final graph, read the rest of this post, or contact Bob for lesson plans, click here: mathcoachblog
Thanks to Bob for sharing this lesson, and Kevin and his Algebra II class for inspiring us with their skills!

Blast-off with Desmos

Earlier this year we received a graph from one of our users that was totally out of this world! Abhishek K., a 10th grader in need of an online, user-friendly graphing calculator, discovered Desmos in the Google Chrome Web Store and decided to take our program for a spin. What came next sent our brains into orbit – Abhishek turned a list of 273 simple equations into an amazing Space Shuttle and launchpad.

View the graph and equations here: www.desmos.com/calculator/if8aqbrqtc

We checked in with Abhishek to learn what inspired him to reach for the stars. Here’s what he had to say:

Q: What was the purpose your graphing project?

A: The purpose of our graphing project was to use all the different conics that included both left, right, up and down parabolas, up/down and left/right hyperbolas, circles, and vertical and horizontal ellipses.

Q: What did you learn by completing it? What math skills did you practice?

A: I learned conic functions a lot better just by seeing the graph, and also learned how increasing or decreasing a number could change the shape of the graph dramatically.

Q: Why did you choose to use Desmos?

A: I chose Desmos because I saw it on the Google Chrome Web Store a few days before using the project so I tried it out and realized it is really easy to use and would be the best choice for the project I was making. I also liked how you can change the colors and store several hundred graphs, which may other online graphing tools don’t let you do. My favorite Desmos feature is definitely the fact that several hundred equations could be used – otherwise this graph would have never been possible.

Thanks Abhishek – way to rocket into the mathosphere!

- Team Desmos

P.S. Will you be at the ISTE conference in San Diego this month? Be sure to visit us at booth #4543 to snag a t-shirt featuring Abhishek’s space shuttle design and equations.

Winner of the Desmos Liberty Bell Curve Challenge

We would like to thank all of you who visited the Desmos booth at the 2012 NCTM Conference in Philadelphia! This year was a great success, and we look forward to helping everyone make the most of our program in their classrooms.

Click here to see who won the Liberty Bell Curve Challenge

During NCTM, we held the Liberty Bell Curve Challenge and gave users a chance to help us free math from the tyranny of expensive hardware by creating their own, customized Liberty Bell graph. Everyone who completed the challenge was entered to win an iPad 3. We held the drawing today to pick the lucky winner – click here to find out who it is!

In the next few weeks we will be announcing many new calculator updates, so be sure to join us on Facebook, Twitter, and our Blog to stay in the loop.

Happy Graphing,
Team Desmos