Explore this graph

Des-blog

Recent Posts

Central Park

From arithmetic to algebra—students need to make this transition.

Too often, students may view these two worlds as discrete and disconnected. Arithmetic is about numbers and answers. Algebra is about letters. An important challenge for teaching is to connect these two—to help students understand that algebra helps us to express the ideas of arithmetic. Algebra makes the structure of our computations clear.

This is a two-way street.

We want students to use their knowledge of computation to inform their algebra understanding, and we want them to see that representing their ideas with algebra can save a lot of computation time.

We don’t want to just tell students that algebra is useful. We want students to experience the power of algebra.

Our latest Desmos classroom activity will put the power of algebra in the hands of students by asking them to design parking lots.

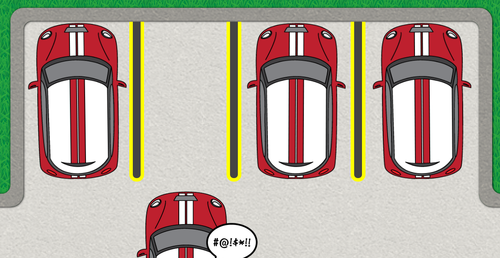
The activity begins simply enough: Space three lines to make a four-space parking lot. Be sure to space those lines equally! They see the cars park in these spaces as soon as they get it right.

Pretty soon, the size of the lot is changing, and so is the width of the lines. Eventually the number of spaces changes too. Students notice these changes. Importantly, they notice what doesn’t change.

We provide the tools for students to notice: They drag the lines to the right places to make equal-sized parking spaces. At this point, they are working with their intuition.

Then we provide students the tools to describe what they notice—first with numbers, and then with algebraic symbols. Continuing a theme we developed in Function Carnival, we also provide the tools for students to see the consequences of their ideas. Allotting too little space between lines will result in scraped fenders, broken side mirrors, and angry drivers. Allotting too much space means there won’t be enough parking spaces.

For students to experience the power of algebra, they need to see their equations in action. Students need to see that their equations work under certain conditions, and that they fail under others. And when the equations fail, students need to be allowed to try again.

As their algebraic power grows, students will become masters of Central Park.

Click through and try Central Park yourself

Why We Made Function Carnival

Here’s why the Desmos team (in collaboration with Dan Meyer and Christopher Danielson) made Function Carnival:

Conceptions and Misconceptions About Graphs

We know it’s important for students to connect different representations of relationships together – linking a table of values to its graph and its algebraic representations, for example. Representing and interpreting relationships between variables is an important skill even for students who do not study math beyond high school. Of all possible ways to represent these relationships, Team Desmos is partial to graphs.

But students struggle with graphs in several ways. We have seen that students struggle with rate, and how rates are represented in graphs. In 1938, an editorial might have argued the economy was in terrible shape because United States unemployment was 17% that year. Another might have argued that the situation was getting better because yes, unemployment was high, but its rate of change was negative.

image

It’s often challenging for students to distinguish between (1) values, (2) the rate of change of those values, and (3) the rate of change of the rate of change.

Students also tend to have the idea that graphs are pictures—that the graph always describes the position of an object in space. Given the graph below, they may think the green car and the blue car collide after four hours.

image

Traditional Interventions

So how do we fix this? Giving students more targeted feedback would be nice, but when a student’s graph is not a correct interpretation of the data, what are our options? We can show them an answer in a key. We can draw the right graph for them. We can have a conversation with students about different interesting wrong answers that may be representative of the entire field of wrong answers. All of these are useful strategies but they all require individual teacher intervention, which is difficult to manage in a large class.

When a student draws a graph with pencil and paper, she also has to imagine what that graph says about the world, and her imagination may be riddled with misconceptions.

Function Carnival

Function Carnival changes that. Students watch a video. They try to graph what they see. Then they play back the video and see how their graphical model would be represented as an animation. Does what they meant to graph about the world actually match the world?

image

They can revise quickly, erasing and re-drawing pieces of their graph.

edit

If a student creates a graph that isn’t a function, the teacher can still tell the student, “That means the person was in two places at once,” but now the student can see all those people also.

image

Pair this digital feedback with a teacher who can help students understand the difference between what they thought was going to happen and what actually happened and you’re readying students for a strong understanding of graphs and their representations. Give it a try.

REFERENCES

Ball, D.L.(2003). What mathematical knowledge is needed for teaching mathematics? Prepared for the Secretary’s Summit on Mathematics, US Department of Education, February 6, 2003; Washington, D.C. Available at http://www.ed.gov/inits/mathscience

Bureau of Labor Statistics. “Graph of U.S. Unemployment Rate, 1930-1945.” HERB: Resources for Teachers, accessed November 8, 2013, http://herb.ashp.cuny.edu/items/show/1510.

Monk, S. “Representation in School Mathematics: Learning to Graph and Graphing to Learn.” In A Research Companion to Principles and Standards for School Mathematics, edited by Jeremy Kilpatrick, W. Gary Martin, and Deborah Schifter, pp. 250–62. Reston, Va.: NCTM, 2003.

Des-man: a Desmos Labs Project

Today, we’re thrilled to introduce a new project: Des-man, inspired by @fawnpnguyen’s eponymous blog post. Des-man is an opportunity for students to flex some creative muscles, draw hilarious faces with math, and learn about domain & range in the process.

You can try it here: https://class.desmos.com/desman

A quick step back before diving into the details: a few weeks ago we released our first piece of collaborative content, a joint project with Dan Meyer called “Penny Circle.” Our two realizations:

(1) it’s really freaking difficult to make thoughtful content.

(2) it’s really freaking fun to make thoughtful content.

Designing even small pieces of curriculum surfaces all of the challenges that we love so much – working at the intersection of technology, design, and pedagogy; navigating the fine line between doing too much and not enough, between guiding and pushing, between delighting and distracting. It doesn’t hurt that content development is also a great excuse to work with teachers, our favorite way to spend time.

For all of these reasons, we decided we wanted to do more. After a quick perusal of some of our favorite Desmos lessons on the web, we settled on Des-man as a perfect fit for our second small project.

Des-man first guides students through the process of making domain & range restrictions in Desmos:

image

Click here to see the sample student view

From there, the prompt is simple: “draw” a face using expressions.

On the other side, every teacher has a dashboard that updates in realtime. Status indicators help identify individuals/groups who are done or stuck. Filters narrow in on just those students who, for example, have experimented with circles or ellipses. One click on any thumbnail opens up a full-screen view of that graph.

image

Click here to see a sample teacher view of Desman

Des-man is what we at Desmos Labs call a WIP, or Work In Progress. We need your help, and here’s how:

(1) Try it out! Let us know where it shines and where it falls short.

(2) Suggest an idea for another lesson, or just let us know you’d be interested in seeing more from Desmos Labs.

(3) Spread the word on Twitter, Facebook, or anywhere else you so desire (Google+? Anyone?)

This is hopefully just the beginning. Ultimately, we want to build out more and more lessons imagined by real teachers. Our dream: that by combining the wisdom of active instructors with the resources of Desmos we’ll be able to create things that far surpass what any of us could build alone.

We hope you’ll join us in making this a reality.

Graph on,

- Eli & Team Desmos


P.S. Special thanks to some of the folks who helped us with this draft of Des-man: @Trianglemancsd, @bobloch, @mbosma8, @LukeSelfwalker, @ddmeyer, and, of course, @fawnpnguyen