Explore this graph

Des-blog

Recent Posts

New calculator features at desmos.com

Operation #Desmazing

Since our calculator was released last year, we’ve received a ton of feedback from users worldwide on features they’d like to see us develop. Well, we listened, and we’re happy to announce that many exciting new features are now live at desmos.com/calculator.

Your des-mission, if you choose to accept it, is to find new calculator updates and share them with us by:

  • • Sending @DesmosInc a tweet with the hashtag #Desmazing
  • • Posting a message on our Facebook wall, facebook.com/desmosinc
  • • Snapping a screenshot of the feature and sharing it on Instagram or Pinterest with the same hashtag, #Desmazing

Share your #Desmazing discoveries with us and we’ll send you an awesome Desmos t-shirt of your choice:

Good luck and happy graphing!

Team Desmos

Screenshot of our new calculator interface - check it out at desmos.com/calculator

ISTE & Operation #Desmazing

Next week Team Desmos takes to San Diego for the International Society for Technology in Education conference (ISTE12). It’s our chance to share how math is fun and desmazing with desmos.com! If you’ll be at #ISTE12, be sure to visit us at booth #4543 – meet our team, learn what we have in the development pipeline, and grab one of these awesome new shirts:

Can’t attend ISTE but you REALLY want one of these cool t-shirts? Read on.

Since our calculator was released last year, we’ve received a ton of feedback from users worldwide on features they’d like to see us develop. Parametrics, more color options, tables - you name it. Well, we listened, and we’re happy to announce that many exciting updates are just around the corner!

But not so fast…

While Team Desmos is offsite at ISTE, we’re sending you on a top-secret mission to uncover new calculator features. Your Des-mission, if you choose to accept it, is to find new calculator updates and share them with us by:

  • • Sending @DesmosInc a tweet with the hashtag #Desmazing
  • • Posting a message on our Facebook wall, facebook.com/desmosinc
  • • Snapping a screenshot of the feature and sharing it on Instagram or Pinterest with the same hashtag, #Desmazing

The first 10 people who share their #Desmazing discoveries with us will win a prize package, complete with a t-shirt of their choice.

The contest begins Sunday evening. Stay tuned for more information!

-Team Desmos

Teacher Feature: Concepts Illustrated

Last Tuesday we brought you the story of Bob & Kevin’s Algebra II classroom conics project. Since then we’ve received messages from teachers across the country who’ve shared how Desmos has also made learning math a more enjoyable experience for their students.

Take Stephen Fast for example, a Calculus and Trigonometry teacher at Pennsylvania State University. We first heard from Stephen back in April when he dropped by our support page to say, “Best calculator ever…finally somebody who ‘gets it!’” Thanks Steve : )

We followed up to learn more about Steve, his students, and get some feedback on how he thought we could make an even better calculator. Here’s what he had to say [answers abridged]:


Q: How have you used Desmos in your classroom?

A: I teach Calculus and Trigonometry at PSU. I often share content in and out of class and encourage my students to use it.

In Calculus I have used the calculator for the sections of the syllabus where one uses 1st and 2nd derivatives to graph functions. It is interesting to be able to see the relationship between the attributes of the graphs of the function, the first derivative, and second derivative all three superimposed.

Q: What is your students’ reaction to the calculator, and why did you choose to use Desmos with your students?

A: I find it is useful to illustrate physical and mathematical principles. The students mostly use it to check their work. It also allows us to have units of pi for axis labels. After discovering all of its features, we never looked further [than Desmos].

Q: What is your favorite Desmos feature?

A: I like to be able to share graphs. I also like the way I can “program” various graphs within the UI. That allows me to put together some very complex graphs and easily change their characteristics.

—–

Over the summer Steve plans on developing more Desmos course content for his students. We can’t wait to see what he comes up with!

-Team Desmos


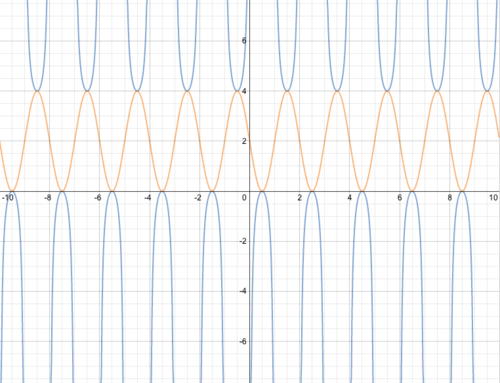
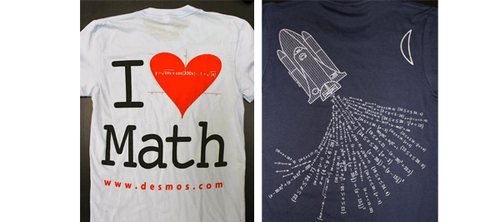
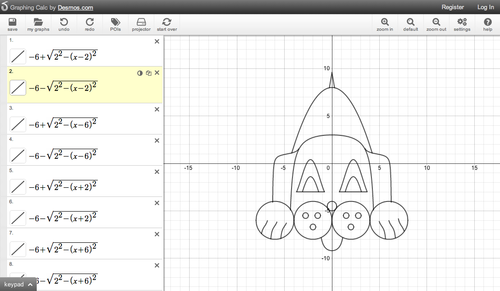
A sample of Stephen’s graphs created at www.desmos.com - view his equations here: http://goo.gl/ZLQiZ