Applications are Open for Cohort 4 Fellows
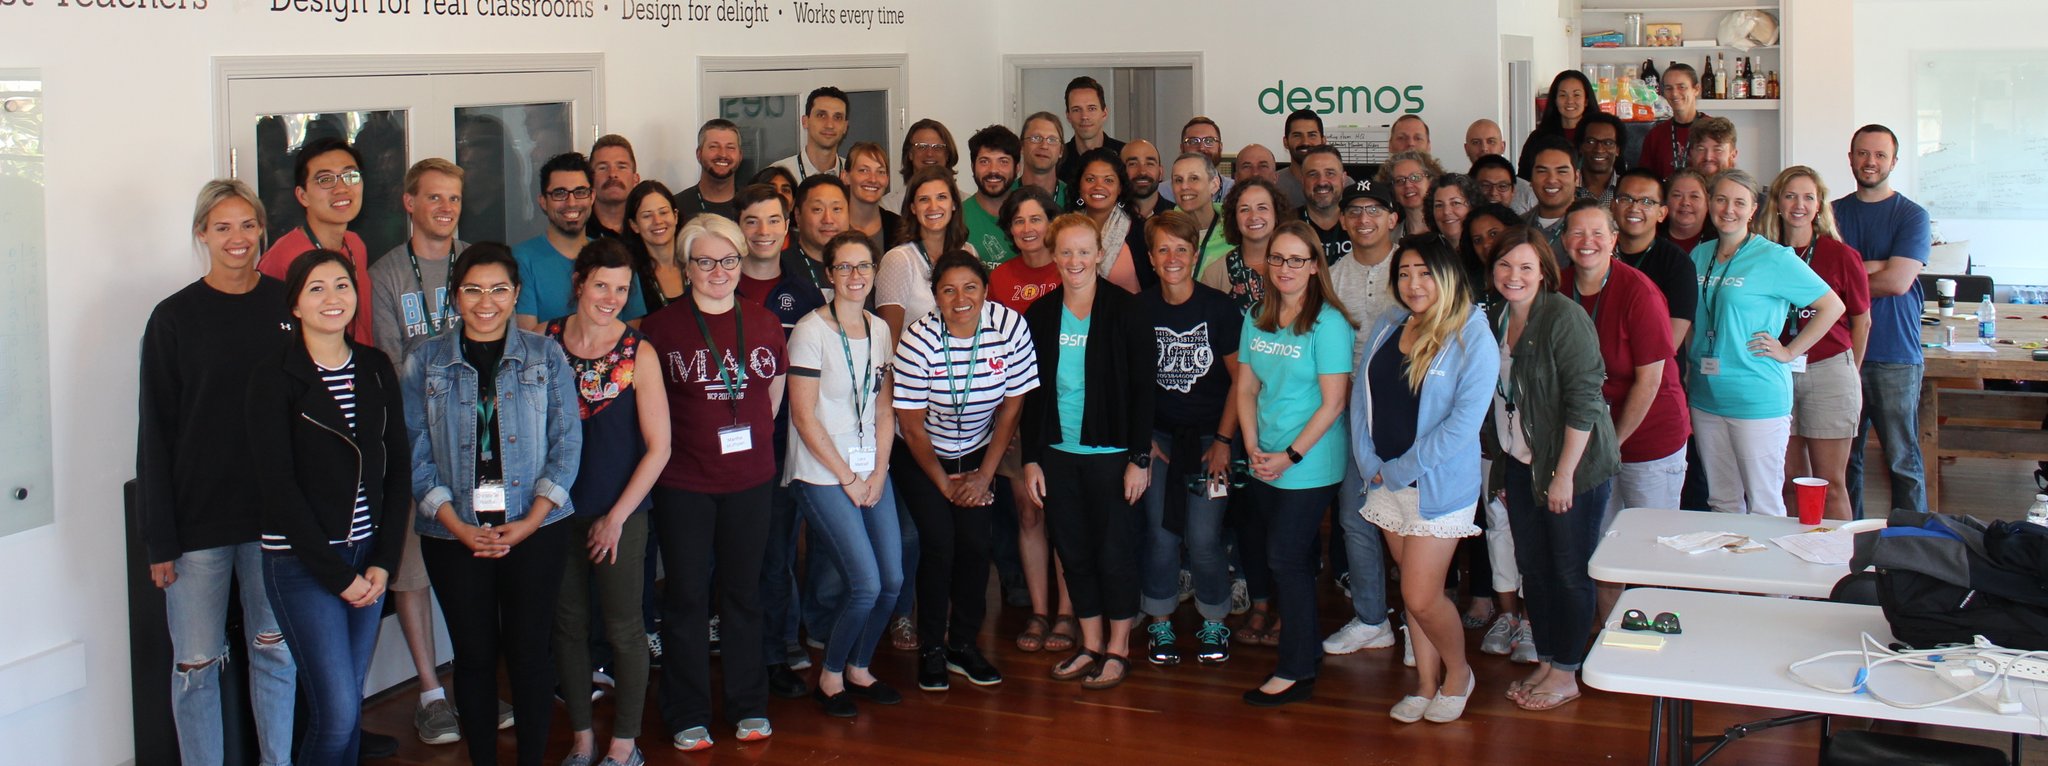 Applications for Cohort 4 of the Desmos Fellowship are now open, and we think you should apply! Here’s what our current Desmos Fellows are saying about the Desmos Fellowship:
- Desmos Fellows weekend was the most amazing professional development I have ever experienced as a math educator. It is difficult to find PD that is a room packed with people so passionate about how we help students learn math and how the technology of Desmos has completely changed how we can do it.
- Desmos Fellows are the math department we all dream about. Supportive, collaborative, caring, and innovative. I strive to create experiences that parallel the experience I had over the Fellows weekend. I didn’t want it to stop and although the weekend did, the support didn’t.
- I was so grateful for all the Desmos knowledge I gained, but more than that I was inspired by the exceptional collection of math teachers. The fellowship felt more personal and impactful than any other PD I’ve attended. The weekend created long lasting connections, both mathematical and professional.
Tags:

 That’s why parametric curves in the graphing calculator are this week’s Friday Fave!