Explore this graph

Des-blog

Recent Posts

Mars Curiosity Rover Graphing Contest

Ever since we first saw that iconic bow-tie, it’s been our dream to work with our favorite Science Guy. This week, we’re thrilled to announce our realization of that dream. Bill Nye, CEO of the Planetary Society, is teaming up with Desmos to celebrate the landing of Mars Curiosity Rover!

====

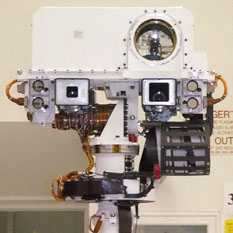
The “face” of the Mars Science Laboratory Rover, Curiosity | Photo by Emily Lakdawalla, Planetary Society

This Sunday at approximately 10:30pm PDT, Curiosity, the shiny new Mars Science Laboratory Rover, will touch down on the surface of Mars! After hitting the Martian atmosphere at 13,000 mph and traveling 154 million miles from Earth, Curiosity will begin it’s 687 day exploration of Mars - searching for life, studying the Martian climate and geology, and collecting samples that will be used for planning future manned missions to the Red Planet.

To celebrate this historic event (and exercise your graphing skills!), Desmos is running a graphing contest for the Mars Curiosity Rover. To participate, submit a graph of Curiosity or another space-themed design. Winners will be given an autographed photo from Bill Nye the Science Guy, CEO of The Planetary Society – the largest space interest group on Earth.

Contest details:

  • Design an original Mars Curiosity Rover or space-themed graph using www.desmos.com
  • Tweet us @DesmosInc with a link to your graph, include the hashtag #CuriosityGraph or
  • Post your graph to our Facebook wall
  • Contest ends Sunday, August 12th - Winners will be announced on our blog and facebook page Monday, August 13th
  • More details: http://goo.gl/6PStz

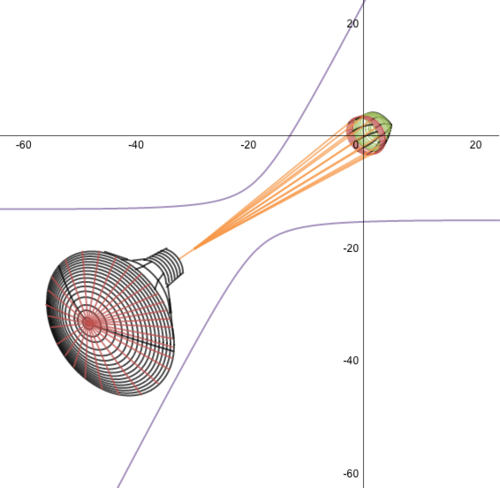
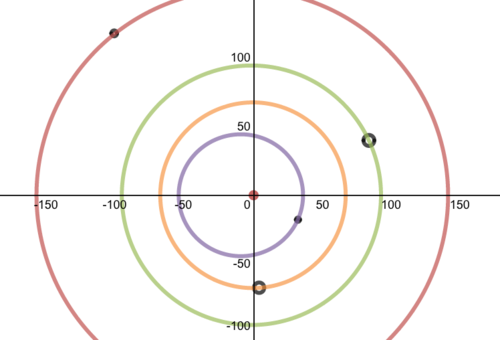
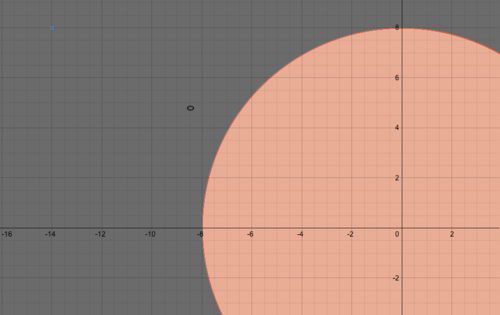
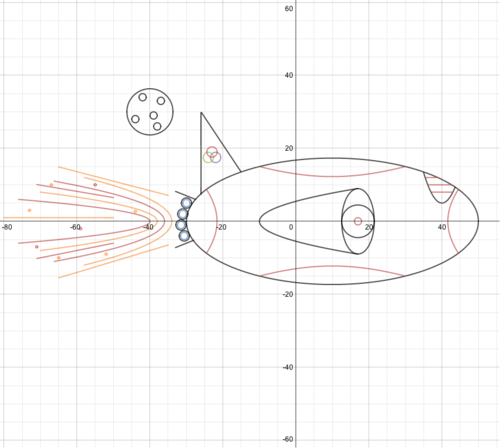
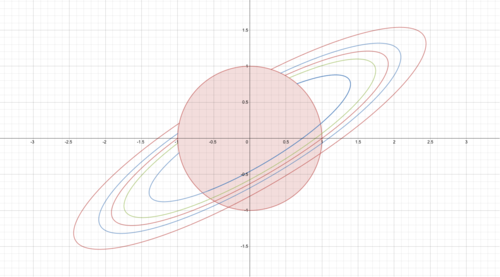
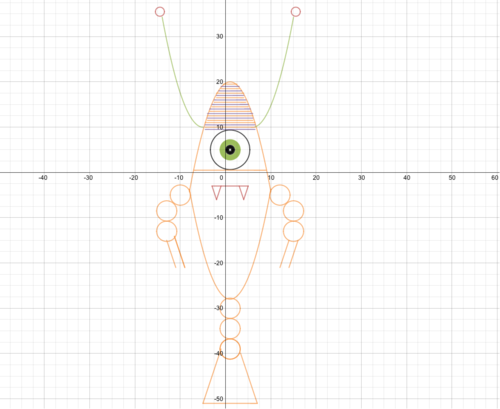
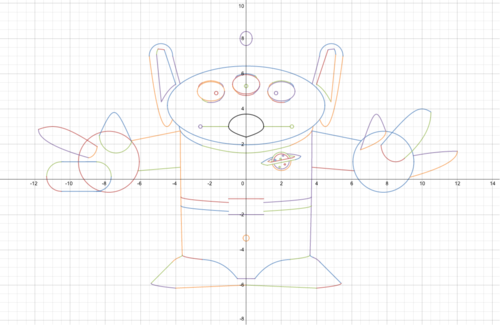
Need inspiration? Check out the photo of the Curiosity’s “face” above, as well as several outer space graphs designed by Desmos users below.

The Planetary Society will be showing a live feed of Curiosity’s landing on its website as part of Planetfest - a two-day celebration for all ages of the real-time landing of Curiosity on Mars. Tune in to Planetfest online and you’ll get a play-by-play narration during the spacecraft’s descent and landing, plus a peek at the first images returned from the mission. More information and the live broadcast link will be posted here: http://www.planetary.org/

Good luck in the contest, and happy graphing!!

Team Desmos

—–

Spaceship and Moon - view equations: http://goo.gl/Fb4Kp

Planet with rings - view equations: http://goo.gl/x43Zy


Alien with hat - view equations: http://goo.gl/2kAkV

Toy Story Alien - view equations: http://goo.gl/hvfZV

Desmos Calculator Update: Navigating the New Calculator

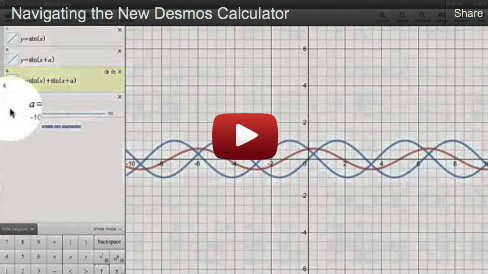
Our last announcement in this latest round of calculator updates is an overview of how to navigate the improved interface and keypad. Here’s a quick tour from Eli:

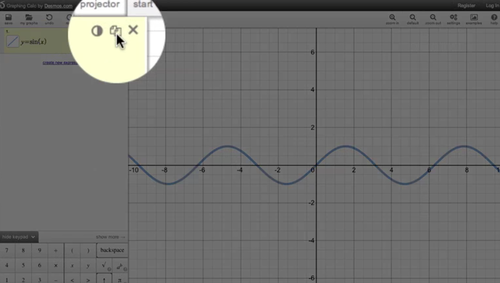
As you can see, we expanded the top toolbar and allowed you to quickly access the tools you use most: undo/redo, POIs (points of interest), projector mode, examples, and help just to name a few.

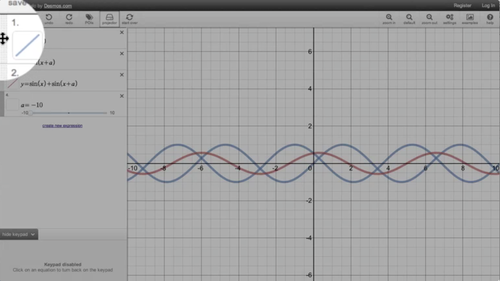
By popular request, you can now copy an expression by clicking the duplication button next to it. To the left, you’ll also see a new button for choosing the color of the curve:


Reordering expressions is a cinch thanks to new drag and drop handles on the left:

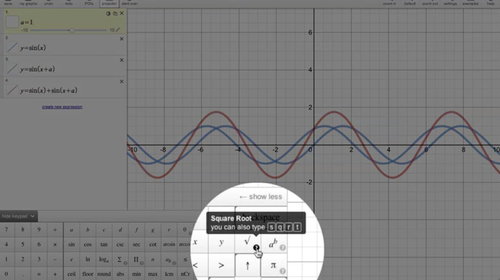
With an enhanced keypad design, typing expressions is as intuitive as ever. Hovering over the buttons will now display keyboard shortcuts and arrow keys have been added for those of you using touchscreens. And at the request of many Desmos users, you can now expand, contract, and even hide the keypad altogether:


We hope you enjoy these updates. For a chance to have your graphs featured in our help section, be sure to Tweet them to us @DesmosInc, post them on our Facebook wall, or send a note to calculator@desmos.com. The most creative graphs will be stored in our help section and a #desmazing package will be mailed to the winners.

Please send us your feedback, and happy graphing!

Desmos Calculator Updates: Points of Interest and Easy-Access Projector Mode

Hello Mathosphere!

After listening to the amazing feedback from our users, we just launched some brand new features on our calculator. First up: points of interest and easy-access projector mode. Watch the video below to see these come to life:

As you can see, it’s now easier to highlight points of interest such as maxima, minima, x and y intercepts, and even intersections between curves. If you add an unknown to create a slider, the points of interest will updates you change the parameter. This is even better demonstrated in projector mode, which we added to the top toolbar because we noticed how much you guys liked it (yay!).

To see the sliders in action, visit desmos.com/calculator and click the “examples” tab. Here you’ll find demos of sliders on parabolas and cycloids – but we need your help.

We’re looking for your inspiring examples to add to our Help section. If you create an amazing graph that shows off what sliders or points of interest can do, please let us know! Tweet us @DesmosInc, post your artwork on our Facebook wall, or send us a note to calculator@desmos.com. The most creative graphs will be featured in our “Examples” section and a #desmazing package will be mailed to the winners.

We hope these new features make it easier than ever to visualize math.

Tomorrow we’ll post another video covering our new parametric feature – please stay tuned!